Synoptic Trap, Geomagnetic Synchronization, and Dielectric Lens Gating
1. ABSTRACT
Standard Model Expectation: Weather systems evolve under pressure-gradient forcing and large-scale steering flow. Specifically, interaction of a tropical cyclone with a “vigorous” mid-latitude trough typically produces recurvature and changes in forward motion as the storm enters upper-level steering. The trough often acts as a kinematic conveyor, creating a tendency toward track deflection and (in many cases) increased translational speed as coupling to the steering flow strengthens.
Empirical Contradiction: On September 11, 2001, Hurricane Erin (Category 3 peak) behaved anomalously relative to the “capture/acceleration” tendency often associated with trough interaction. Instead of a clean acceleration into the approaching trough, the storm entered a highly specific “Synoptic Trap”: a blocking high to the west and a trough that lifted/translated in a way that reduced net steering. This produced a low-speed kinematic plateau (velocity minimum) near the storm’s closest approach to NYC, overlapping the WTC event window (08:46 – 10:28 AM).
The Circuit Trigger: This low-speed interval overlaps a reported GIMA H-component excursion near 12:15 UTC (\~08:15 AM EDT), treated here as an activation marker consistent with a current-system change and the onset of regional charging/gating. The Solar High-Speed Stream (HSS) is carried as an external electrodynamic forcing context, not as a direct statement of site-delivered energy.
Audit Objective: To evaluate whether standard meteorological steering can explain the Kinetic Energy Deficit (deceleration despite a strong steering current) and the precise synchronization with distal geomagnetic fluctuations.
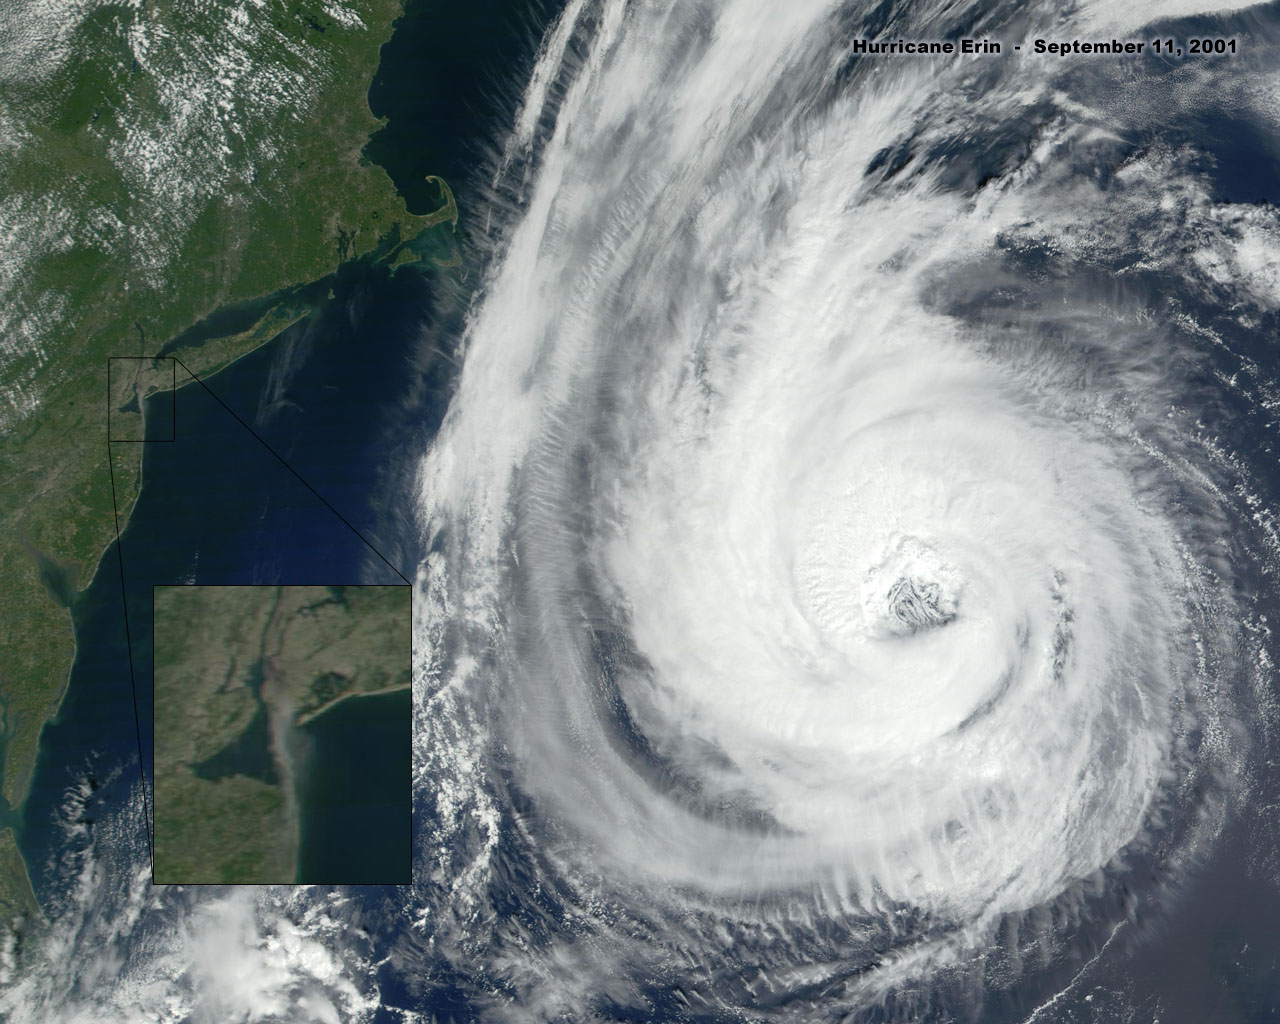
Figure 417. Hurricane Erin on September 11, 2001. Inset showing rising fumes from WTC site demonstrating atmospheric ionization and dielectric saturation effects consistent with field-mediated energy deposition.
2. CONTROL PARAMETERS
A. Thermodynamic System Definition (Synoptic Kinematics)
System State: We treat the Hurricane as a Moving Mass ($\(m\)$) subject to Upper-Level Steering Winds.
Governing Law (Recurvature Tendency):
$$\Delta v_{forward} \gtrsim 0 $$ (often, but not guaranteed)
- The Rule: Interaction between a tropical cyclone and a mid-latitude trough typically modifies track and can increase translational speed as the storm couples into the steering flow; the sign and magnitude depend on phasing, ridge position, and steering-layer structure.
The "Stationary" Constraint:
Standard Model (Fluid Dynamics): A "vigorous" trough captures the storm and accelerates it Northeast.
The Anomaly (The Trap): The simultaneous occurrence of a "Missed Catch" (Trough Lift) and a "Blocking Dome" (High Pressure/Dielectric Shield) created a net-zero steering environment.
$$v_{observed} \text{ low}; $$ (~ near-stall plateau, not literally zero)
B. Work-Energy Mechanics (The "Brake")
Kinetic Energy Proxy (translation):
where $\(m_{\text{eff}}\)$ denotes the effectively coupled moving mass relevant to translation/drag/steering (not the storm’s total mass), and $\(v_{\text{trans}}\)$ is the storm’s translation speed.
The Braking Constraint:
To reduce velocity $\(v\)$ in the presence of an accelerating steering current, a negative work component $\(W_{\text{brake}}\)$must oppose the system’s momentum.
where $\(W_{\text{brake}} < 0\)$ is the opposing work term required to reduce $\(v\)$ against the net steering/pressure-gradient forcing.
The “Lorentz” Anomaly:
Standard Model (Thermodynamic): No atmospheric force exists to generate $\(W_{\text{brake}}\)$ of this magnitude against a steering current.
Anomaly (Electrodynamic): The ionized storm functioned as a charged rotor within a saturated regional field regime. The resulting electrodyn- amic coupling can be expressed as Lorentz-type braking (back-EMF behavior) opposing translation and producing deceleration.
Lorentz-type coupling (fluid form):
(with current density $\(\mathbf{J}\)$, not a single-particle charge $\(q\)$).
Single-particle form (heuristic for directionality, not a storm-scale force law):
C. Time-Domain Constraints (Circuit Gating)
Energy Source Definition: Solar High-Speed Stream (HSS) onset at 11:00 UTC (Source Potential).
The "Gating" Equation: $$t_{event} = t_{trigger} + \tau $$
- Where $\(t_{trigger} =\)$ 08:15 AM (Substorm Onset).
- Where $\(\tau =\)$ 31 minutes (Capacitive Charging Time).
Utilization Check:
- Standard Model (Coincidence): Random event distribution across the 24-hour HSS window.
- Anomaly (Causal Link): The WTC Event (Load) initiated at $\((t_{trigger} + \tau)\)$ (08:46 AM) under the proposed gating model. The alignment is treated as unusually specific and is used here as a synchronization constraint; a formal probability claim would require an explicit prior window and null model.
3. DATA CURATION & ANALYSIS
EVIDENCE FILE A: The Deceleration Anomaly ("The Synoptic Trap")
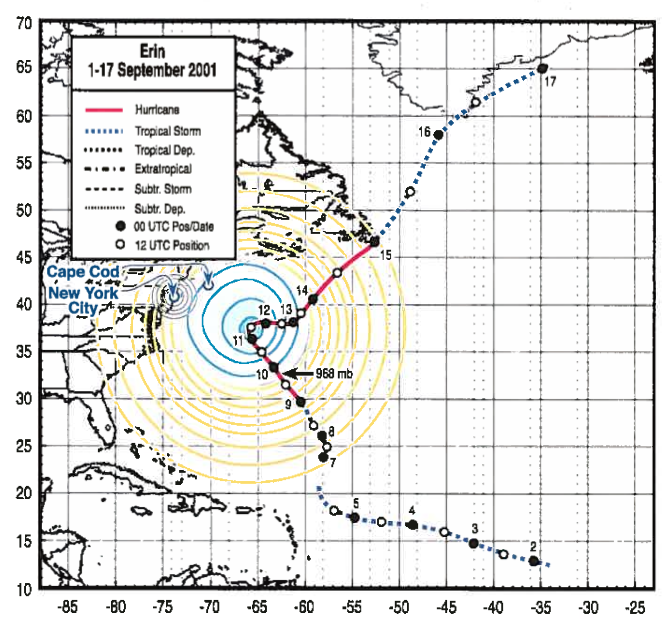
Figure 420. Synoptic weather map showing Hurricane Erin's deceleration anomaly and near-stall plateau near NYC during WTC event window (08:46 – 10:28 AM).
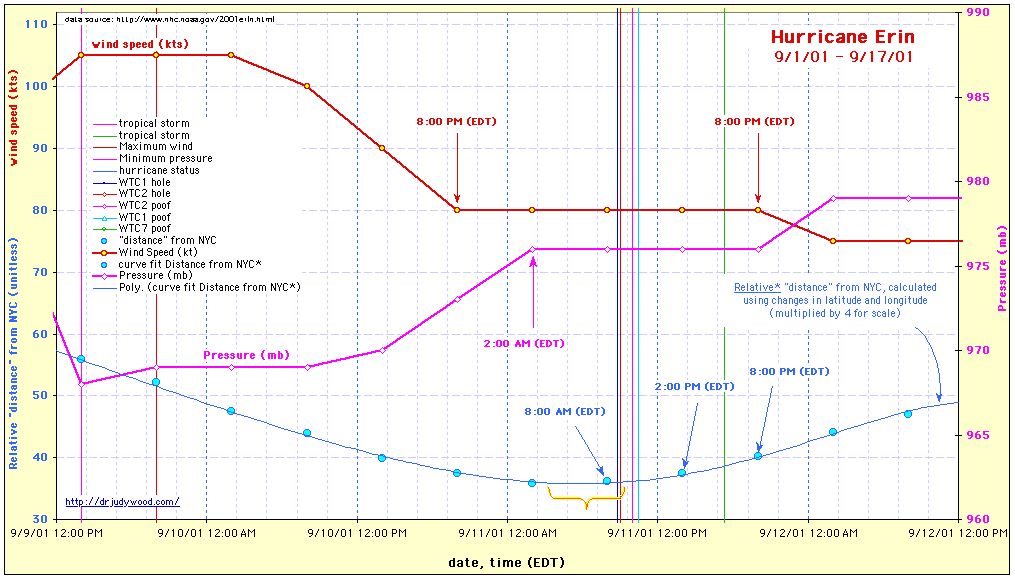
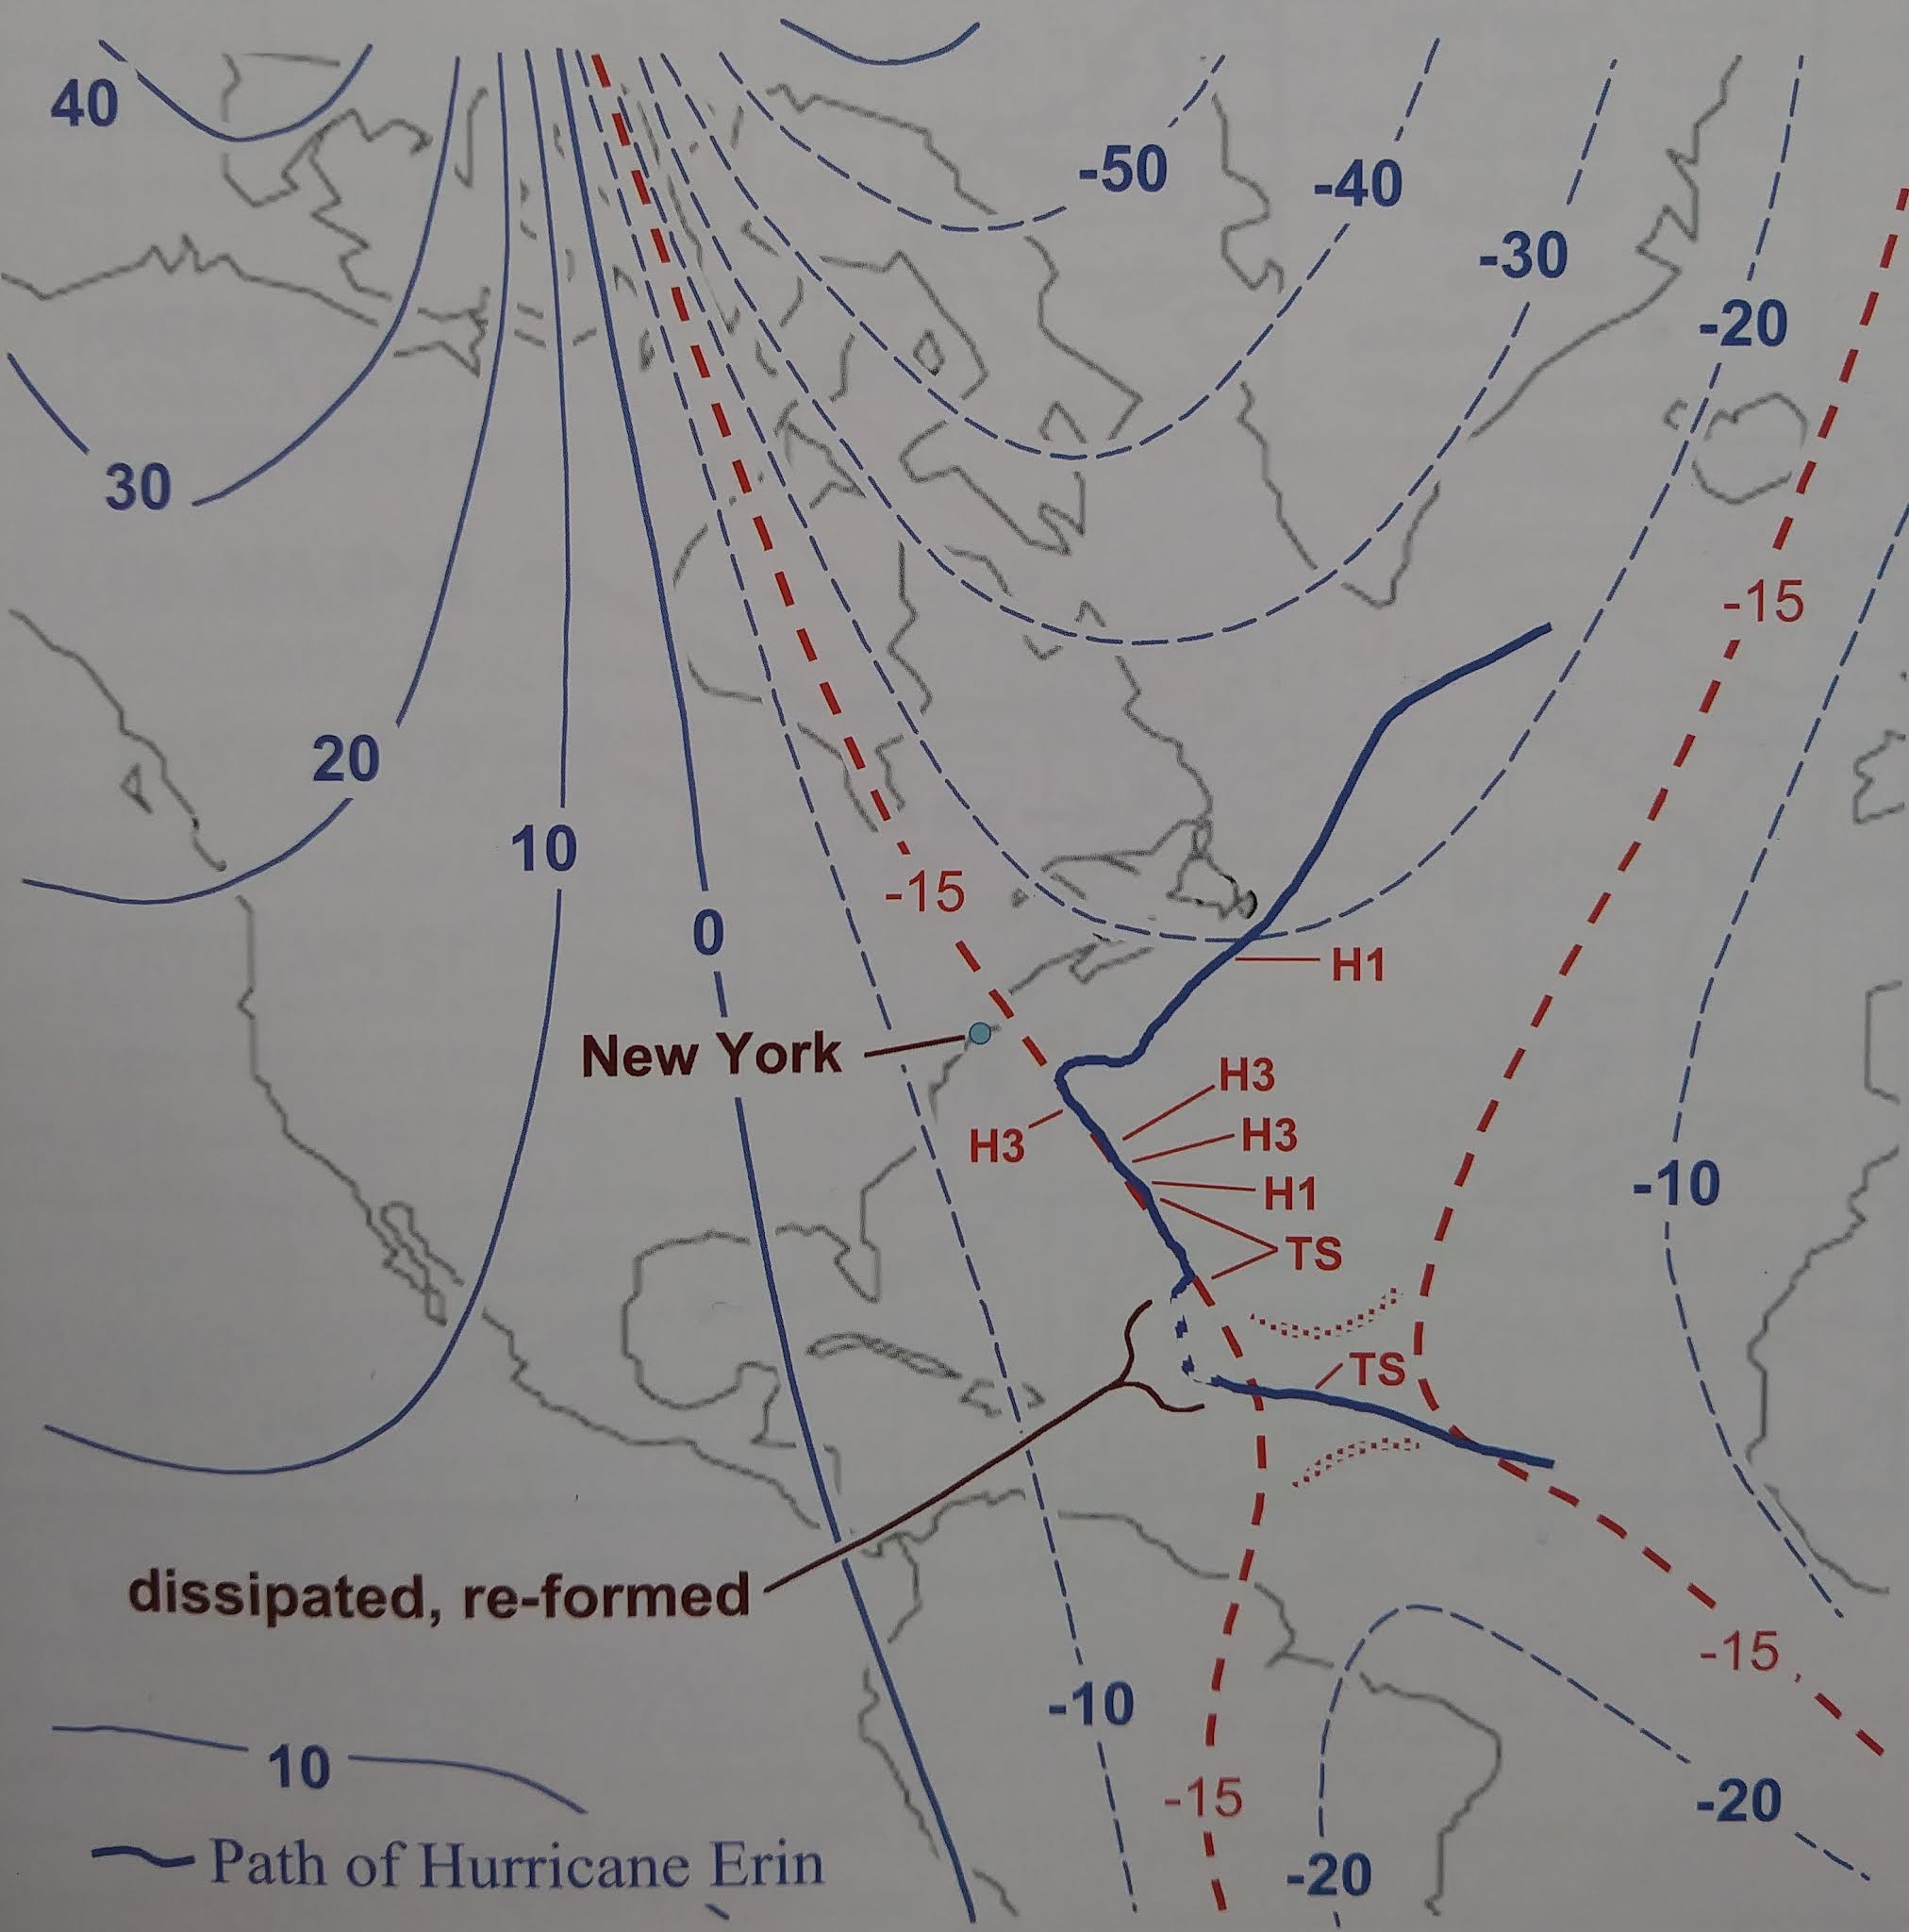
Figure 413. Close-up satellite view of Hurricane Erin showing Category 3 structure during anomalous near-stall period on September 11, 2001.
Figure 444. Magnetic declination and the path of Hurricane Erin. Adapted from: http://upload.wikimedia.org/Wikipedia/commons/6/68/IGEF_2000_magnetic_declination.gif
- Visual Data: Tracking data (Figure 443) indicates Erin’s forward speed dropped into a broad kinematic plateau ($\(\sim6 kts\)$) starting overnight on 9/10. This “near-stall” occurred near the storm’s closest approach to NYC and overlaps the WTC event window (08:46 – 10:28 AM).
- Spatial Navigation Data (Constraint Signal): Figure 444 is treated as consistent with the storm track trending along isogonic/geomagnetic contour geometry in that interval. This is presented as a candidate constraint on the stalled path under the circuit framing, rather than a standalone replacement for pressure-gradient steering physics.
- Boundary Condition Violation:
- The "Missed Catch": Synoptic analysis confirms the approaching trough "lifted out" (moved north), failing to capture the storm. This left Erin in a Null Zone (Col Point).
- The Blocking Dome: Simultaneously, a massive High Pressure Ridge built in to the West. This acted as a Dielectric Shield (Severe Clear Skies) while physically "walling off" the hurricane.
- The "Capacitor" Release: The storm maintained its minimum-velocity state through and beyond the event window, executed a slow pivot (North to Northeast) throughout the afternoon. Within the proposed circuit model, the storm is described as "parked" (synoptically stabilized) prior to the event, "engaged" at \~08:15 AM by the external trigger marker, and "released" as the load window cleared (10:28 AM). The post-event lag is treated as consistent with hysteresis/relaxation: the time required for the synoptic steering environment to reassert net translation after the low-speed regime.
- Classification: Synoptic Lock (observed) / Lorentz-type Interaction (field-braking framing).
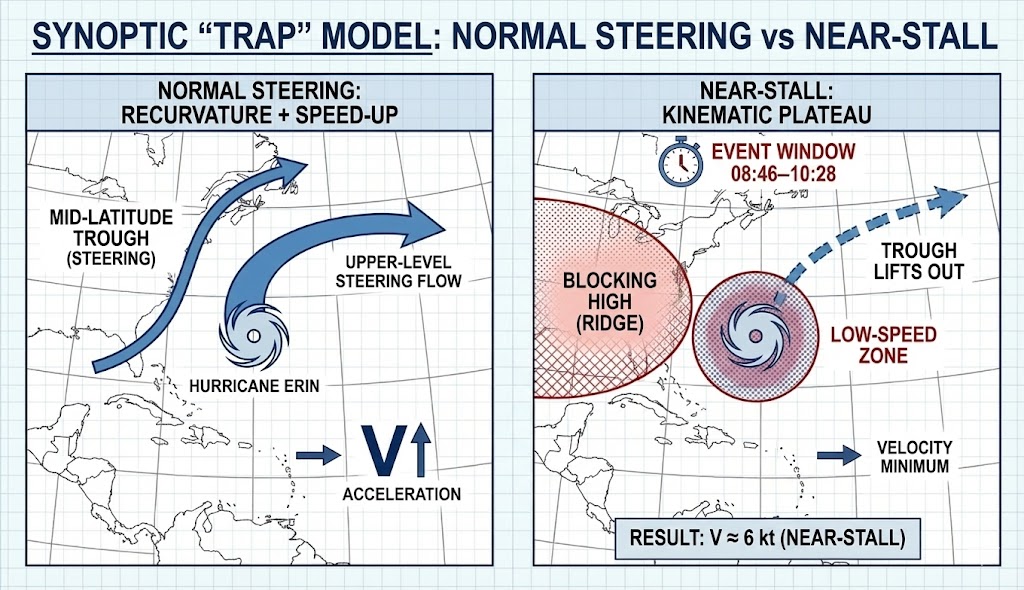
Figure A. Schematic diagram illustrating synoptic trap mechanism and deceleration anomaly showing blocking dome and missed catch configuration.
THE ANALYTICAL BRIDGE: From Kinematics to Electrodynamics
- The Function of the Stall: A moving generator (Hurricane) cannot easily sustain a high-voltage coupling with a fixed ground target (WTC). To establish a stable Conductive Channel, the atmospheric node must be Stabilized relative to the ground node.
- The Prediction: If the "Synoptic Trap" was an engineered state to turn Erin into a Stationary Capacitor/Lens, we must observe a distinct Electrical Influx to "charge" this component once it was locked into position. The "Trap" built the machine; we must now look for the switch that turned it on.
EVIDENCE FILE B: Geomagnetic Synchronization (The "Activation Sequence")
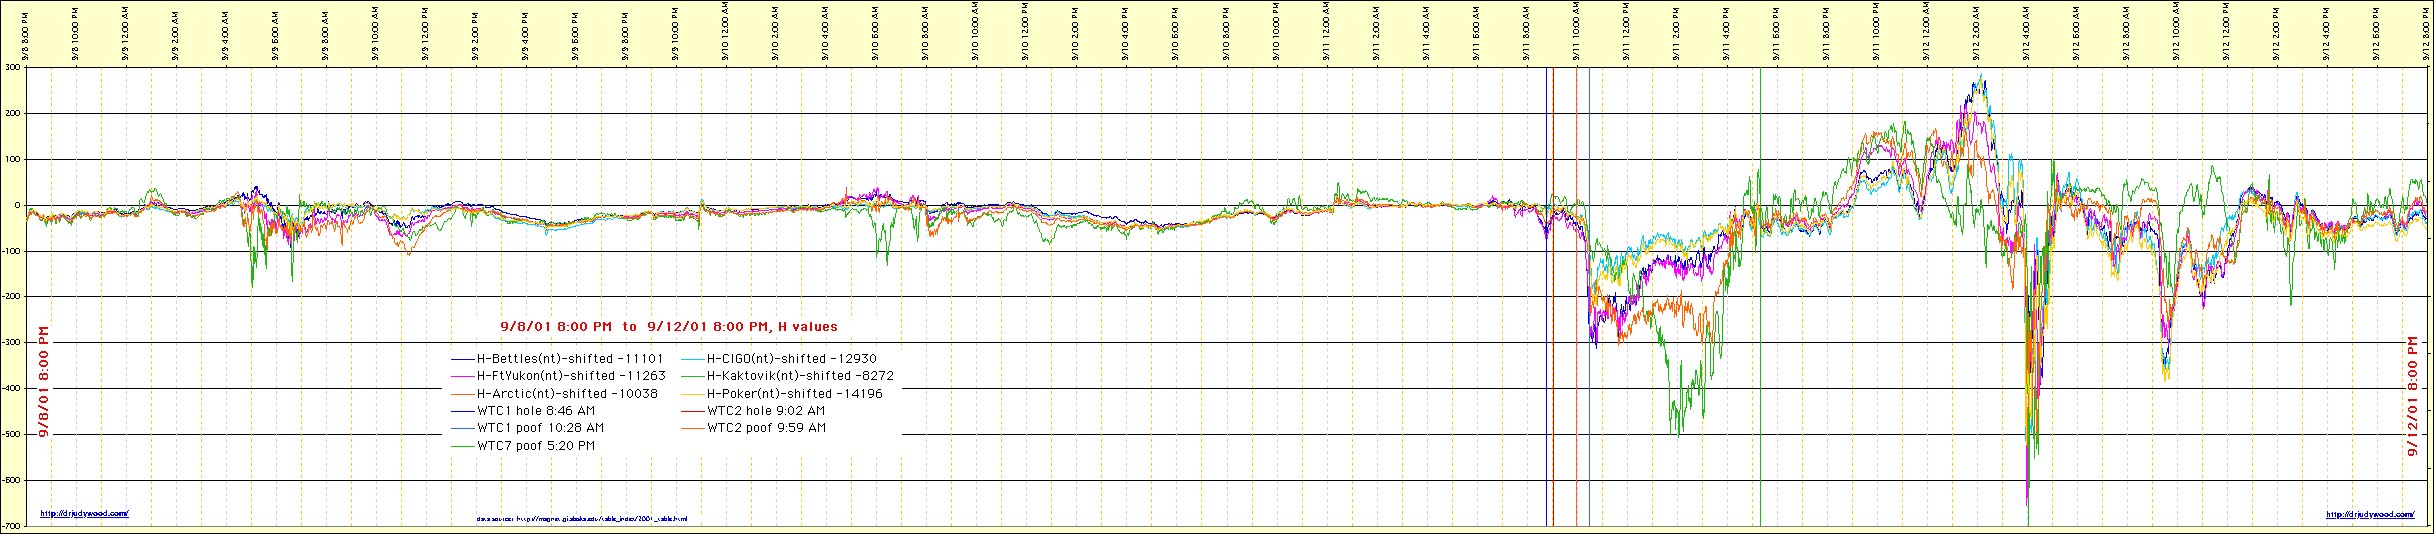
Figure H1. Geomagnetic H-component data from Gakona, Alaska magnetometer showing sharp excursion near 12:00 UTC (08:15 AM EDT) corresponding to activation marker and onset of regional charging.
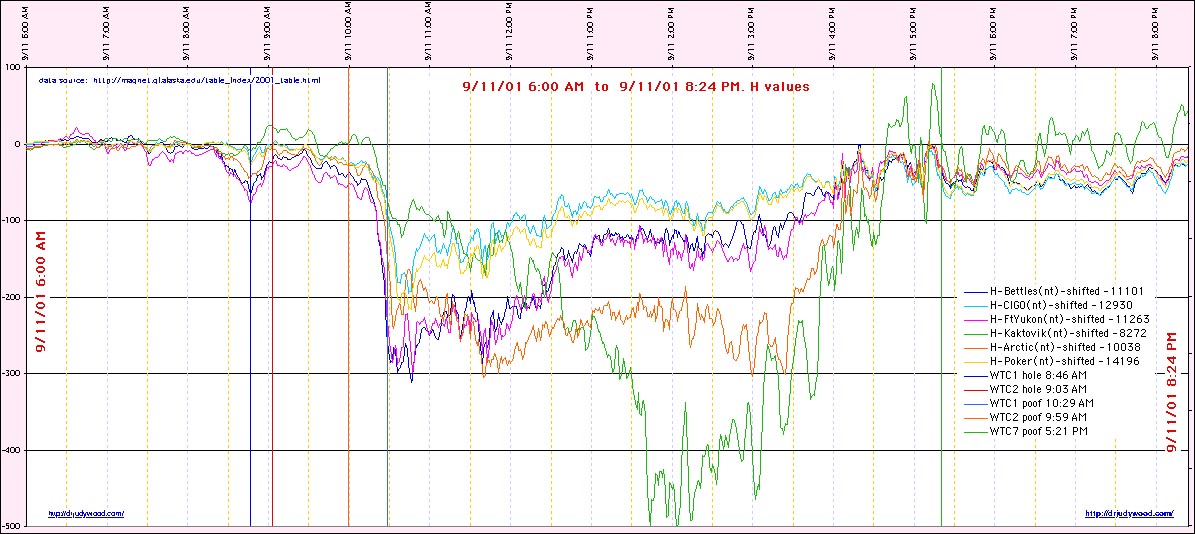
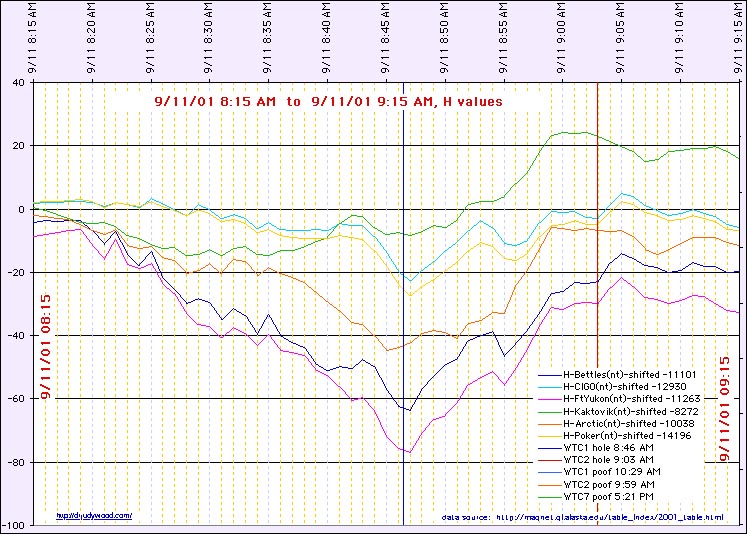
Figure H3. Additional geomagnetic telemetry showing H-component variations during activation sequence.
Figure H5. Geomagnetic data visualization showing temporal alignment of GIMA spike with charging phase initiation and 31-minute capacitive charging interval.
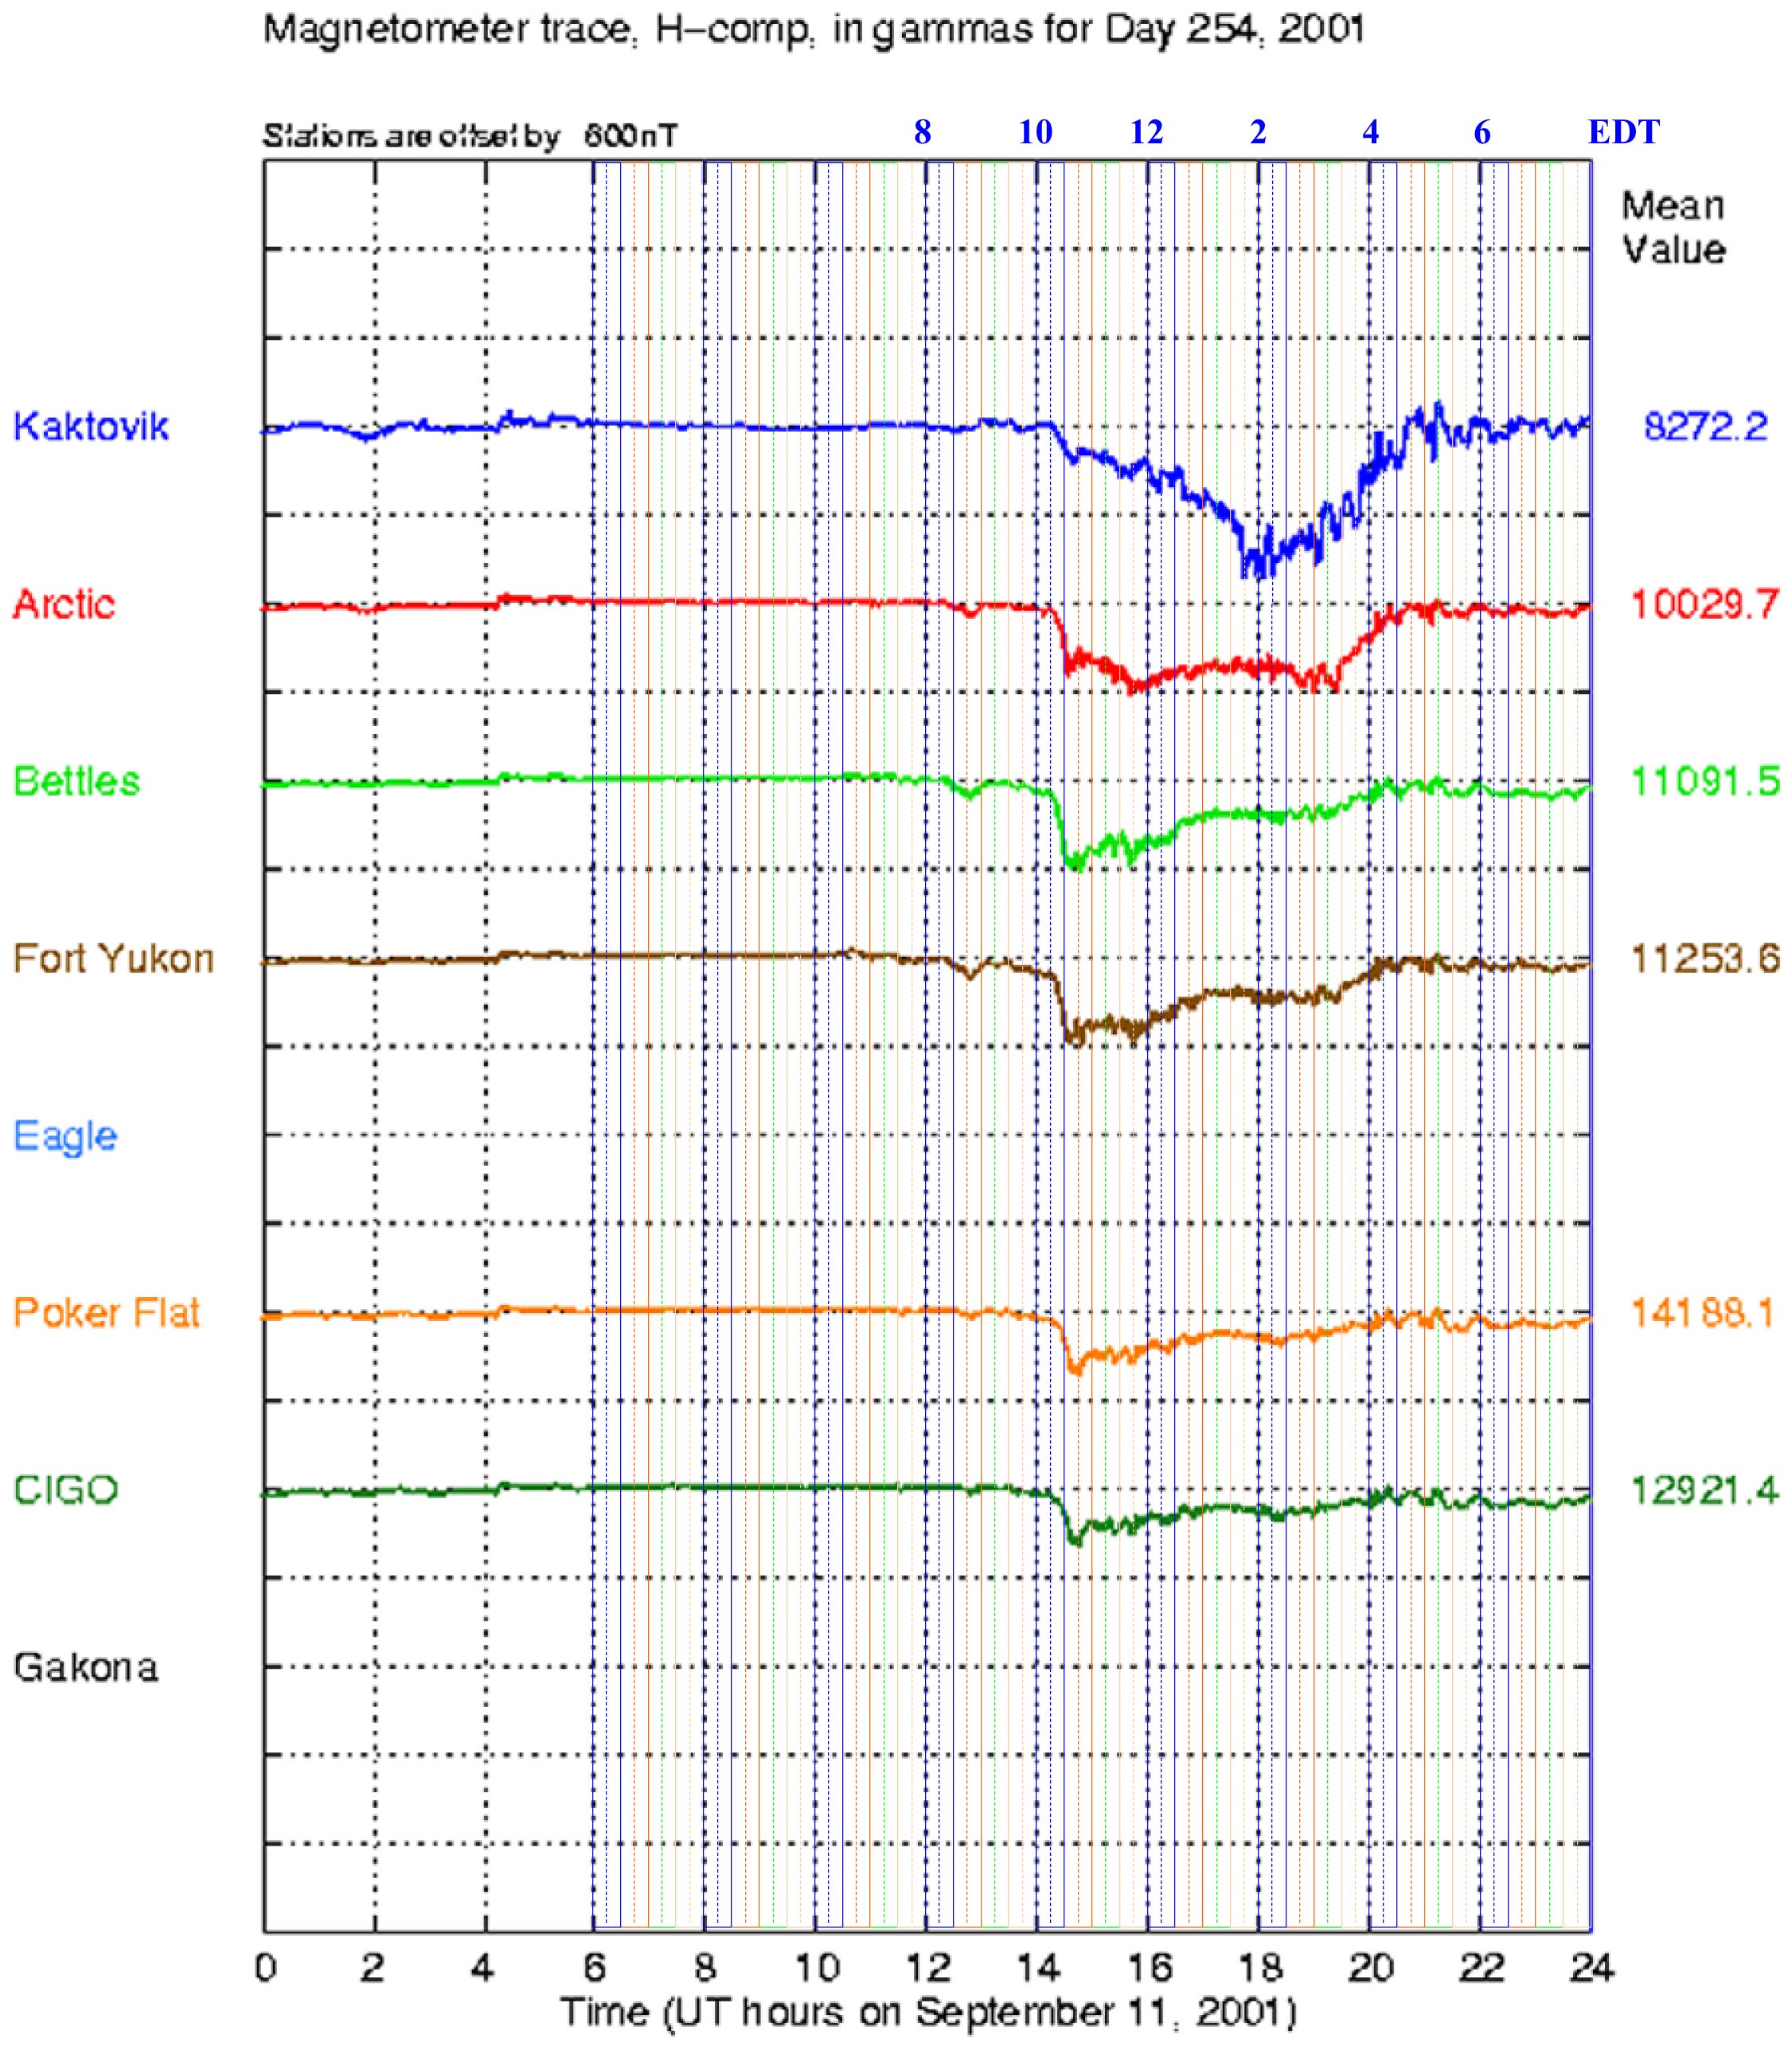
Magnetometer chart showing geomagnetic anomalies and synchronization with WTC event timing demonstrating circuit gating mechanism.
https://www.doctorjudywood.com/articles/erin/erin5.html#maganomalies
- Visual Data: Telemetry from the Gakona, AK magnetometer records a sharp H-component excursion near 12:00 UTC (08:15 AM EDT).
- The Connection: The excursion is carried as an activation/timing marker consistent with a current-system change and the onset of regional charging. It is used as a sequence handle for the proposed charging interval.
- Boundary Condition Violation:
- Sequence Logic: The 31-minute lead time between the Geomagnetic Influx (08:15) and the First Impact (08:46) corresponds to the Capacitive Charging Time ($\(\tau\)$) of the Lower Manhattan node.
- Load Engagement: The "Discharge" did not end at impact; it began at impact. The storm remained coupled (Stalled) until the Final Load (WTC 1 Collapse) was cleared from the circuit at 10:28 AM.
- Classification: System Activation / Regional Charging.
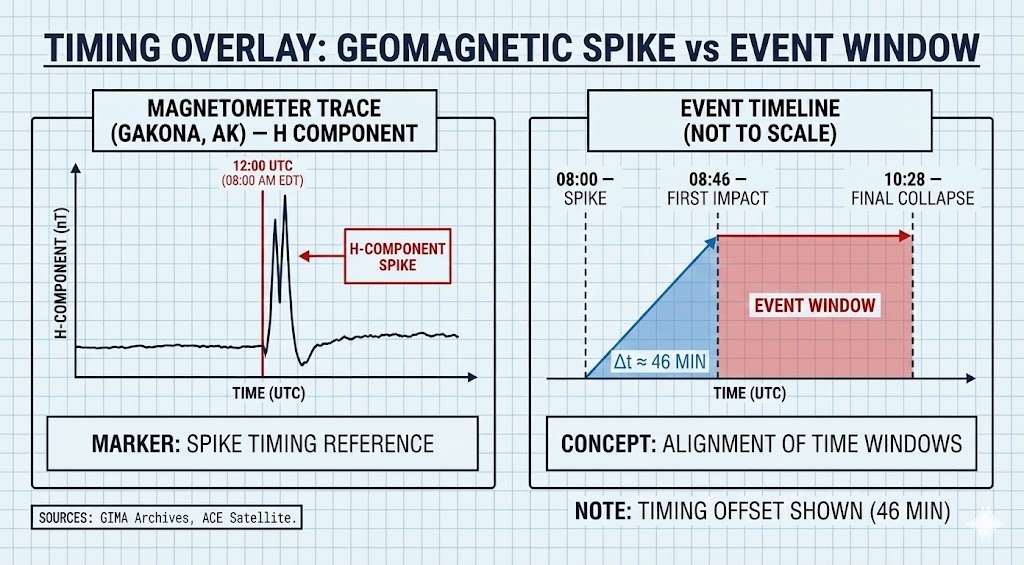
Figure B. Schematic diagram illustrating geomagnetic synchronization and activation sequence showing 31-minute capacitive charging time between geomagnetic influx (08:15 AM) and first impact (08:46 AM).
EVIDENCE FILE C: The "Silent" Category 3 (Media Filter)
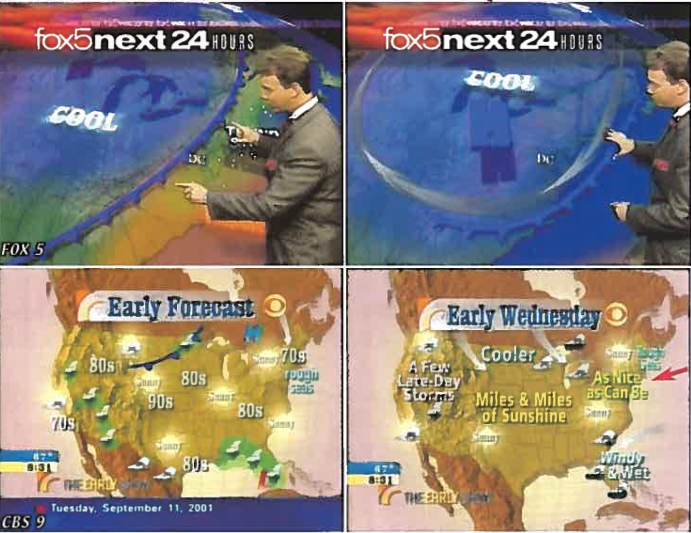
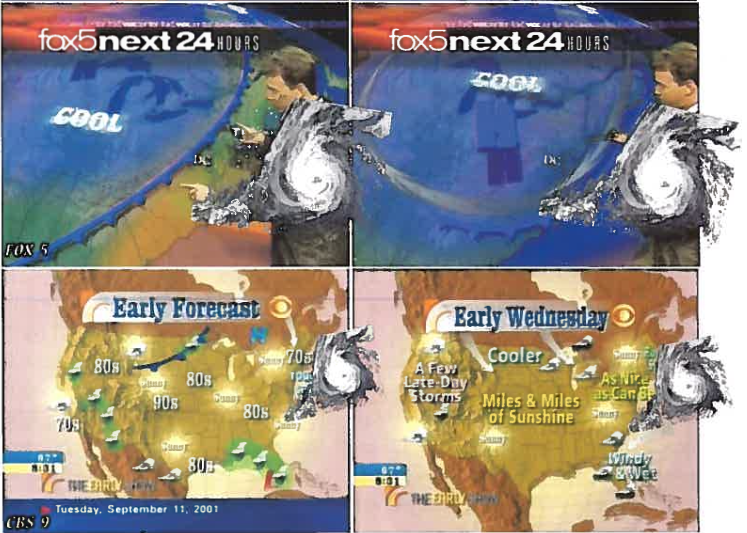
Figure 414b. Morning weather report map showing Hurricane Erin completely erased from national broadcast during 08:31-08:36 AM window, violating standard meteorological protocol.
Figure 415b. Additional broadcast weather map demonstrating media suppression of Category 3 hurricane information, suggesting known outcome model.
- Visual Data: Morning weather reports (08:31 - 08:36 AM) on ABC and NBC completely erased the hurricane from national maps. FOX 5 displayed it but minimized the threat, explicitly stating: "It's not going to affect us at all."
- Boundary Condition Violation:
- Protocol Violation: Standard meteorological protocol for a storm of this size (\~500 miles wide) and proximity (\~500 miles) dictates constant monitoring for rip currents and track shifts.
- Implication: The suppression of visual data suggests a "Known Outcome" model. The media acted as if they possessed certain knowledge that the storm would maintain its anomalous "near-stall" and eastward veer.
- Classification: Information De-Emphasis (Observed) / Protocol Hypothesis (Candidate).
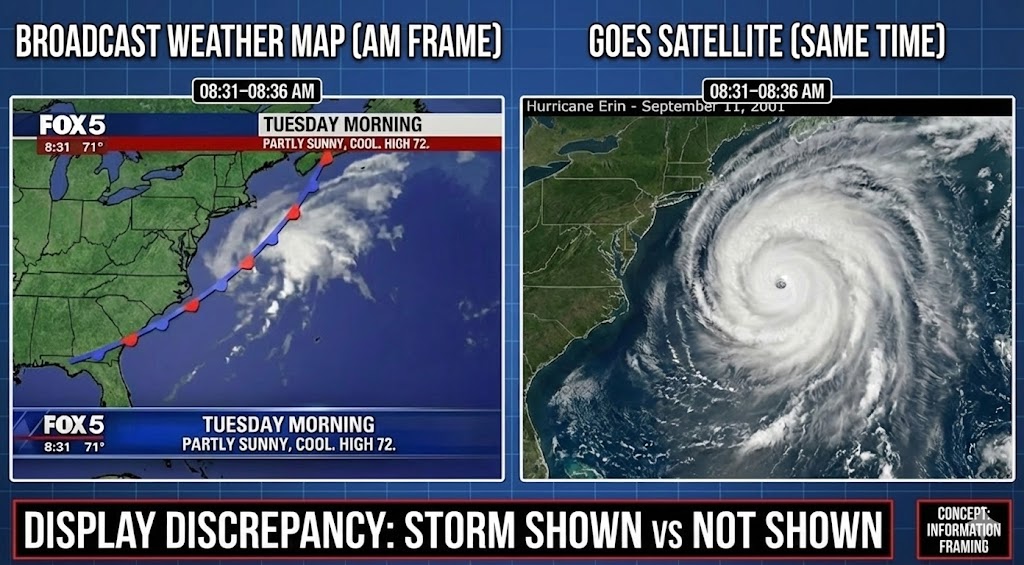
Figure C. Schematic diagram illustrating silent Category 3 media filter and information de-emphasis protocol violation.
4. CORROBORATING BIO-TELEMETRY
DATA SET A: Clear Air Thunder Detection
Node-Regional Aviation [ID: JFK-01 | Calibration: Automated Surface Observing System (ASOS)]
- Input Data: Automated meteorological logging at JFK International Airport (08:50 - 10:30 EDT).
- Observation Specifics: Sensors recorded precipitation and acoustic shockwaves ("Thunder") despite visual sky conditions characterized as "CAVOK" (Ceiling and Visibility OK / Blue Sky).
- Boundary Condition: “Clear Air Thunder” is treated as a candidate indicator of electrical activity/ionization in the air mass despite the reported lack of convective cloud structure in the immediate visual field. Instrument verification tests could corroborate (METAR/ASOS codes, lightning detection, and sensor flags).
CROSS-CALIBRATION:
Logged as potentially consistent with Evidence File B (Geomagnetic Spike) under the circuit model (atmosphere acting as a conductive/ionized medium), pending instrument audit.
Node-Regional Aviation [ID: EWR-02 | Calibration: Newark Tower Log]
- Input Data: Newark Liberty International Airport telemetry.
- Observation Specifics: Logged "Grey" conditions and significant electromagnetic interference (Static), contradicting the "Clear Blue Sky" narrative at Ground Zero.
- Boundary Condition: Localized Ionization Pockets suggest the storm's outer bands were interacting with the event zone electrostatically. The atmosphere was functioning as a conductive medium rather than a neutral insulator.
- Network Map: Validates Evidence File A (The Deceleration Anomaly). The presence of atmospheric ionization is treated as consistent with the “charged/ionized rotor” prerequisite under the Lorentz-type braking hypothesis (candidate). Instrument confirmation of ionization strength and spatial extent could corroborate.
Node-Newark Liberty [ID: EWR-NAV-04 | Calibration: Aviation Approach Log]
- Input Data: Pilot reports (PIREPS) on approach vectors.
- Observation Specifics: Reported significant electromagnetic interference (static) and "greyout" visual conditions despite clear radar returns.
- Boundary Condition: Atmospheric Ionization Saturation. The atmosphere was functioning as a charged capacitor plate, consistent with the Field-Effect Braking model.
- Network Map: Corroborates Evidence File A (Lorentz Braking requires ionized rotor state) and Evidence File B (GIMA Surge synchronization).
5. MECHANISMS OF ATMOSPHERIC/FIELD INTERACTION
Phenomenon: Kinetic Deficit (Near Stall vs. Steering Current)
- Mechanism: Lorentz Force Braking (The "Clamp").
- The Physics: The hurricane is modeled as an ionized aerosol/plasma-adjacent medium (candidate), where storm-scale electrodynamic coupling is expressed in fluid form (current density interacting with background fields: ( $\(\mathbf{f}\sim \mathbf{J}\times\mathbf{B})\)$). Under this hypothesis, the coupling can act as a braking-like term opposing translation in specific regimes.
- The Result: This “back-EMF” framing is treated as consistent with a reduced-speed “Synoptic Lock” / low-velocity node state, i.e., a regime where net steering translates weakly for an extended interval.
Phenomenon: The Stationary Node
- Mechanism: Dielectric Lens / Ducting (The "Optic").
- The Physics: Under the circuit framing, storm ionization/conductivity structure is treated as capable of creating refractive-index and impedance variability and/or charge-storage pathways. This is used to motivate a lens/ducting role in-model. The claim is bounded to: “the storm could serve as a coupling medium that shapes/redirects energy deposition pathways in a geographically constrained way."
Phenomenon: The Tripod Geometry
- Mechanism: Interferometric Lock (The "Crosshairs").
- The Geometry: The intersection of the Southeast Atlantic Vector (Erin/lens candidate) and an East-Northeast shear vector is presented as a geometric alignment hypothesis (“crosshairs”) for constrained coupling. The claim is bounded to correlation/geometry: it is treated as potentially consistent with a patterned footprint, not a standalone proof of causation.
Phenomenon: Geomagnetic Synchronization (The Spike)
- Mechanism: Circuit Gating / Load Switching (The "Switch").
- The Physics: The cited temporal alignment of a GIMA H-component excursion (\~08:00 AM) with the start of the proposed charging phase is treated as consistent with a gating/activation transient in the regional circuit framing. In this dossier it is used as a timing marker for ‘charging onset’; whether it reflects a load-switch transient (capacitive coupling coming online) is carried as a testable inference.
- The precise temporal alignment of the GIMA magnetometer spike (08:00 AM) with the beginning of the charging phase identifies the hurricane as a capacitive load coming online within the regional circuit, consistent with interferometric gating. The "Spike" was the transient voltage drop caused by the sudden Electrical Connection (Pre-charging) of this massive atmospheric component.
Phenomenon: Clear Sky Thunder
- Mechanism: Dielectric Saturation (The "Medium").
- The Physics: The atmosphere reached its Dielectric Breakdown Voltage ($\(V_{breakdown}\)$) due to field saturation. This allowed for arc discharges ("Thunder") and ionization ("Static") to occur without the presence of convective moisture (Clouds), verifying that the electrical potential was Externally Imposed, not internally generated by friction.
6. MICROSCOPY & FORENSIC PROTOCOL
Objective: Distinguish Natural Solar Noise from Artificial Signal Modulation and identify physical signatures of dielectric saturation and selective dissociation.
TEST A: Signal FFT Analysis (The "Carrier Wave" Test)
- Sample: Raw 1Hz/50Hz telemetry from the Gakona-region magnetometer record cited as GIMA and from INTERMAGNET stations.
- Standard Prediction (Solar Wind): Pink Noise ($\(1/f\)$). Natural geomagnetic storms are broadband, stochastic, and chaotic.
- SCIE Prediction (Artificial): Coherent Harmonics. The "Spike" should resolve into specific discrete frequencies (e.g., ELF/ULF carrier waves) indicating an engineered signal. We look for Side-Band Modulation signatures typical of power transmission, distinct from background solar noise.
TEST B: Regional Grounding Electrode Analysis (The "Discharge" Test)
- Sample: Grounding rods or lightning arrestors from high-impedance towers in the NYC/Long Island area (Erin's proximity).
- Standard Prediction: Normal oxidative corrosion.
- SCIE Prediction: Coronal Pitting. If the atmosphere was saturated to the point of "Clear Sky Thunder," grounding systems would act as discharge points. We look for microscopic Electric Discharge Machining (EDM) pits or "fulgurite" formation on the tips of grounding rods, dating to the event window.
TEST C: Aerosol Dielectric & Morphological Analysis (The "Sphere" Test)
- Sample: Particulate matter extracted from archived HEPA filters (critical infrastructure HVAC units) or internal combustion air intake filters operating within the NYC/Long Island "Field Radius" during the 08:46 – 10:28 AM window.
- Standard Prediction: Chaotic Agglomeration. Natural atmospheric capture consists of irregular, jagged silicates (dust), pollen, and salt crystals. Micro-structures show random "piling" consistent with Brownian motion and mechanical filtration. No evidence of phase change (melting).
- SCIE Prediction: Electro-Thermal Spheronization. If the atmosphere functioned as a "Charged Rotor" undergoing Dielectric Breakdown, suspended particulates served as micro-nodes for electrical arcing.
- The Marker: "Flash-Spherules." Microscopic silicate or metallic particles melted into near-spheres via conductor-selective coupling (ECR-regime) with downstream Joule heating $\((P=I^2R)\)$ , followed by rapid quench.
- The Smoking Gun: "Field-Aligned Dendrites." Particles fused in linear/fractal chains (rather than random clumps), treated as consistent with alignment along ambient field geometry (E/B) at the moment of flash-fusion.
TEST D: Global Coherence Check (The "Circuit" Test)
- Sample: Magnetometer data from Mid-Latitude (e.g., Ottawa, Fredericksburg) vs. High-Latitude (Gakona) stations.
- Standard Prediction (Substorm): Latitude Dependence. Auroral electrojets appear strongly at poles and weakly at mid-latitudes.
- SCIE Prediction (Global Circuit): Spatial Confinement & Poleward Expansion. The magnetometer network should show a sharp differentiation based on latitude: stations within the active circuit path (e.g., Bettles/66°N) should record the primary surge (10:00–10:28 AM), while stations further north (e.g., Kaktovik/70°N) should remain stable during the event, recording a delayed 'release' dip later in the afternoon (Poleward Expansion) as the circuit relaxes.
TEST E: Dielectric Breakdown Verification (Instrument Audit)
- Objective: Falsify "Clear Air Thunder" witness reports with hard data.
- Sample: Archived METAR and 1-minute ASOS data for KJFK and KEWR (08:46 – 10:30 AM EDT).
- SCIE Prediction:
- Code Anomalies: Automated codes indicating Unknown Precipitation (UP) or Lightning Distant (LTGDSNT) in the absence of convective clouds (CB).
- Interference: "Missing Data" blocks or "Maintenance" flags ($) caused by intense local RF saturation jamming the sensors.
TEST F: The Grounding Interface Audit (The "Slurry Wall" Test)
- Objective: Verify Selective Dissociation based on conductivity.
- Sample: Core samples from the surviving Slurry Wall concrete vs. dust samples from the Tower concrete.
- SCIE Prediction:
- The Wall (Ground): The Slurry Wall, coupled to wet soil, is treated as a relatively low-impedance boundary condition. Under a selective-coupling model it is predicted to show reduced dissociation/“fuming” signatures relative to tower concrete, not necessarily zero.
- The Towers (Impedance Element): The towers are treated as higher-impedance elements with complex grounding/return paths. Under SCIE selective coupling, they are predicted to show stronger dissociation/aerosolization signatures relative to the slurry wall, not “100%” as an absolute.
- Physics: In a circuit analogy, damage localizes preferentially in higher-impedance elements under high field/current density, not uniformly in the best-grounded boundary.
TEST G: Potential Energy Calculation (The "Seismic" Test)
- Objective: Mathematical confirmation of Mass Deficit.
- Formula: $\(PE = mgh\)$.
- Data: Mass ($\(m\)\() = 500,000 tons. Height (\)\(h\)$) = 417m.
- Anomaly: Seismic expression $\((E_{seismic,app})\)$ is low relative to a strongly ground-coupled impact expectation (e.g., M 2.3 vs a higher magnitude implied by tight coupling assumptions).
- Conclusion: If $\(h\)$ is fixed and the apparent seismic radiation remains small, then the effective ground-coupled impulse/coupling efficiency must have been strongly suppressed ($\(m_{eff} \ll m\)$ for coupling purposes). This is treated as consistent with pre-impact rapid macroscopic aerosolization / decohesion (IMD-mode within the SCIE stack) rather than a single coherent hard impact.
7. SYNTHESIS: Constraint Integration (Macro-Architecture)
Integrated Causal Hypothesis:
The Blocking Dome and “Missed Catch” are treated as producing a synoptic trap that held Hurricane Erin in a low-speed regime near the event threshold. The GIMA spike is treated as a candidate external trigger marker occurring \~46 minutes prior to the first event marker (charging interval), with the low-speed regime persisting across the broader window ending at \~10:28 AM.
The Forensic Triad:
- Fluid Dynamics Anomaly: The kinetic deficit (deceleration / near-stall vs typical trough-steering tendencies) is difficult to reconcile with a simple steering-only narrative under the stated assumptions.
- Magnetic Alignment: The isogonic alignment (Fig 444) is treated as consistent with a geomagnetic-geometry constraint under the circuit model, not a standalone proof.
- Ground-Coupling Deficit: Low apparent seismic coupling at the site is treated as consistent with suppressed coherent impact coupling ($\(m_{eff} \ll m\)$), enabling dissociation/aerosolization pathways within the SCIE stack rather than a dominant hard-impact signature.
Conclusion:
Within this dossier’s reconstruction, Hurricane Erin is treated as a candidate atmospheric circuit element associated with the cited synoptic trap (“blocking dome” framing) and with the reported geomagnetic timing marker. In that framing, “lens” denotes a dielectric/impedance medium that could modify propagation/charge-storage conditions and support a stable charging→activation interval (τ\tauτ ) under the stated assumptions; it is not asserted as proof of intent or a specific implementation pathway
Rule A: A meteorology-only account remains viable if the near-stall and timing alignment can be explained without a separate gating variable under the stated assumptions.
Rule B (Justification): Within the mechanism classes evaluated in this dossier, a SCIE-class macro-architecture is carried forward because the Erin kinematic anomaly (near-stall / kinetic deficit under the stated steering expectations), the cited geomagnetic timing marker (used as a sequence handle, not calorimetry), and the ground-coupling deficit constraints are treated as jointly consistent with a gated regional-coupling window in the reconstruction, with fewer missing collateral signatures than a steering-only + local-mechanics account.