REFERENCE LIST - Image Citations and References
This page provides comprehensive citations for all images, photographs, and other referenced materials used throughout the SCIE Dossier, organized by report number and chronologically within each report.
Report 1. Macroscopic Lattice Dissociation
Figure 1. Semendinger, Greg (Photographer). (2001, September 11). Aerial view of WTC1 during the destruction, showing massive dust cloud engulfing lower Manhattan. New York City Police Aviation Unit. Image captured during aerial surveillance of 9/11. JW Original Source
Figure 2. Spencer, Robert (Photographer). (2001, September 11). WTC2 upper section tilting at an angle, showing initial angular momentum vector before aerosolization. Associated Press (AP). Close up of original photo. Original Source
Figure 3. Samoilova, Gulnara (Photographer). (2001, September 11). WTC2 upper section tipping and beginning to expand outward into spherical aerosol configuration. © Gulnara Samoilova/ZUMAPRESS.com. Original Source
Figure 4. Unknown Photographer. (2001, September 11). WTC2 upper mass expanding outward in spherical aerosol expansion, dissipating mid-air before ground impact. Taken from the southeast. Original Source
Figure 5. Sancetta, Amy (Photographer). (2001, September 11). WTC2 upper section tilting and beginning to dissipate into aerosol cloud. Associated Press (AP). Original Source
Figure 6. Sancetta, Amy (Photographer). (2001, September 11). WTC2 upper section continuing to expand and aerosolize mid-air. Associated Press (AP). Original Source
Figure 7. Semendinger, Greg (Photographer). (2001, September 11). WTC1 steel core columns remaining upright after surrounding building aerosolization, showing the spire steel beams disintegrating into dust. New York City Police Aviation Unit. (cropped) Original Source
Figure 8. Unknown Photographer. WTC1 steel core columns beginning to disintegrate from the top. WTC7 and water tower in the foreground. Original Source
Figure 9. Unknown Photographer. WTC1 steel core columns continuing to fade into particulate cloud. Original Source
Figure 10. Unknown Photographer. WTC1 steel core columns further disintegrating into aerosol. Original Source
Figure 11. Unknown Photographer. WTC1 steel core columns nearly completely converted to particulate matter. Original Source
Figure 12. Jeff Mock. (~ March 2001). Aerial view of World Trade Center and surrounding area of New York, Downtown Manhattan in the foreground, looking north easterly.
Photo by Jeff Mock. Original Source
Figure 13. Federal Bureau of Investigation (FBI). (2001, September 13). Ground level view looking east, in front of where WTC1 once stood showing minimal debris pile, less than 2% of original building height. Original Source
Report 2. Pre-kinetic Particulate Emission and Athermal Dissociation
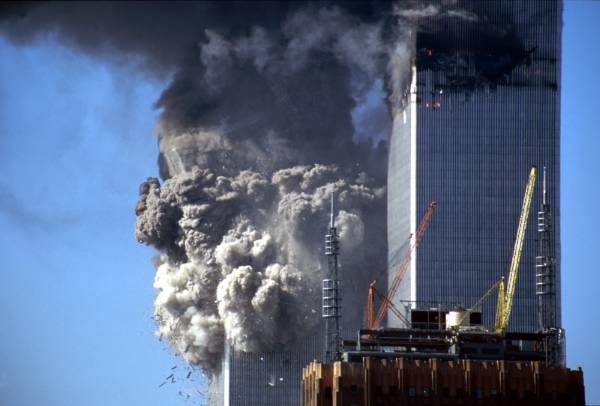
Figure 14. Semendinger, Greg (Photographer). (2001, September 11). WTC1 showing white/gray particulate cloud emission along vertical building face prior to structural failure, exhibiting rapid volumetric expansion. New York City Police Aviation Unit. Original Source
Figure 15. Unknown Photographer. (2001, September 11). WTC7 showing particulate emission emanating from East and North faces minutes before collapse, demonstrating pre-kinetic aerosol generation. Original Source
Figure 16. Semendinger, Greg (Photographer). (2001, September 11). WTC1 emitting distinct toroidal vortex structures from north face, showing coherent glow without flame indicating non-flame luminescence and pulsed ejection driver. New York City Police Aviation Unit. Original Source
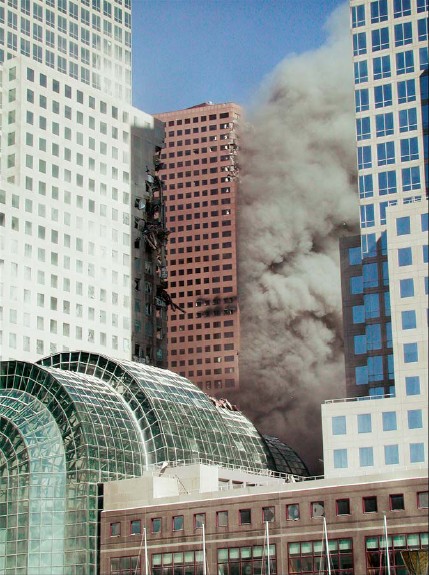
Report 3. Volumetric Debris Analysis and Mass Preservation Audit
Figure 17. Federal Bureau of Investigation (FBI). (2001, September 13). Looking East at ground zero showing vast open space where WTC1 stood, with street-level ambulance visible and unobstructed, demonstrating the football field void anomaly. The remains of stairwell B in background. Original Source
Figure 18. National Oceanic and Atmospheric Administration (NOAA) / U.S. Army JPSD. (2001, September 16-23). LIDAR image of the WTC complex showing the remains of WTC1, WTC2, other WTC buildings, with elevation color-coded (green: lower, yellow/orange/red: higher); WTC 6 appears as a depression. Original Source
Figure 19. Nachtwey, James (Photographer). (2001, September 11). Panoramic view looking north-northeast directly in front of where WTC1 stood, showing vast open space with minimal debris pile, demonstrating volumetric mass deficit. WTC7 in the background at this point. Time Magazine. Original Source
Figure 20. Spencer, Robert (Photographer). (2001, September 11). WTC2 top block tilting eastward as rigid structure, beginning to transition into dust cloud before ground impact, showing mid-air phase change. Associated Press (AP). Original Source
Figure 21. Sancetta, Amy (Photographer). (2001, September 11). WTC2 top block tilting eastward, showing initial angular momentum vector before dissociation. Associated Press (AP). Original Source (cropped)
Figure 22. Sancetta, Amy (Photographer). (2001, September 11). WTC2 top block continuing to tilt and beginning to lose structural coherence, transitioning from solid to particulate. Associated Press (AP). Original Source (cropped)
Figure 23. Sancetta, Amy (Photographer). (2001, September 11). WTC2 top block completely vanished into dust cloud mid-air, demonstrating rapid macroscopic aerosolization before ground impact. Associated Press (AP). Original Source (cropped)
Figure 24. Biggart, Bill (Photographer). (2001, September 11). WTC3 showing a missing section after the destruction of WTC2 and just before the destruction of WTC1. WTC 3 exhibiting progressive structural subtraction and near-total volumetric disappearance. Copyright 2001 by Bill Biggart/SIPA Press. Original Source
Figure 25. Unknown Photographer. (2001, September 11). WTC 3 showing massive volumetric deficit where structural core has vanished, leaving minimal rubble pile inconsistent with original building mass. Original Source
Figure 26. Sealy-Fraser, Natasha (Photographer). (2001, September 11). WTC courtyard view of Austin J. Tobin Plaza during 9/11. Light debris covers the rooftops of WTC4 (left) and WTC5 (right). WTC3 in between the towers. Original Source
Figure 27. Unknown Photographer. (2001, date unknown). WTC4 showing vertical bisection and progressive structural subtraction, demonstrating the vanishing core anomaly. Original Source
Figure 28. Petrov, Konstantin (Photographer). (1990s-2001). Typical WTC office interior showing standard office contents including desks, chairs, telephones, filing cabinets, and other durable furnishings that would be expected to remain as macroscopic fragments after collapse. Original Source
Figure 29. Unknown Photographer. (2001, August 22). Typical WTC office interior showing standard office contents including desks, chairs, telephones, filing cabinets, and other durable furnishings that would be expected to remain as macroscopic fragments after collapse. Under this audit framing, the reported scarcity of recognizable contents post-event is treated as consistent with material-selective coupling and/or elevated fines production rather than simple kinetic crushing alone. Original Source
Report 4. Athermal Plasticity and Field-Mediated Interfacial Bonding Anomalies
Figure 30. Unknown Photographer. (2001-2002). File Cabinet from a Ben & Jerry's ice-cream shop under the WTC complex. The paper retained its color, indicating this file cabinet did not shrivel due to conventional heat. Fused filing cabinet artifact showing paper documents embedded in resolidified ferrous metal matrix, with paper fibers visible and legible without carbonization. Original Source
Figure 31. Unknown Photographer. (2001-2002). Close up of the File Cabinet from a Ben & Jerry's ice-cream shop under the WTC complex. The paper retained its color, indicating this file cabinet did not shrivel due to conventional heat. Close-up view of filing cabinet artifact showing paper documents embedded in steel matrix, demonstrating athermal interface bonding without cellulose pyrolysis. Original Source(Image cropped)
Figure 32. Johnson, Lane (Photographer). The 'Meteorite' that was once preserved in Hangar 17 of John F. Kennedy International Airport (JFK) for WTC remains. High-density fused agglomeration of resolidified ferrous metal and concrete aggregate with embedded paper documents, showing heterogeneous composite artifact. Original Source
Figure 33. Unknown Photographer. (2001-2002). Close up of part of the 'Meteorite' that was once preserved in Hangar 17 of John F. Kennedy International Airport (JFK) for WTC remains. According to Peter Gatt (preservationist), it is the spine of a report. Detailed view of meteorite artifact showing paper fibers embedded in metallic matrix, with legible text and no evidence of carbonization or ash formation. Original Source (no longer available)
Figure 34. Unknown Photographer. Group of fused coins recovered from the debris of the World Trade Center. Fused cluster of U.S. coinage containing zinc-rich pennies and copper-nickel coins with individual minted relief and geometric integrity preserved. Original Source
Report 5. Plastic Deformation and Non-Axial Curvature in Structural Steel
Figure 35. National Institute of Standards and Technology (NIST). WTC beams (Perimeter column panels) WTC perimeter column assemblies wrapped into tight cylindrical spirals, showing smooth continuous curvature inconsistent with gravity collapse or conventional explosion. Original Source
Figure 36. National Institute of Standards and Technology (NIST). Perimeter column assembly showing three columns and spandrel plates wrapped in tight spiral with concentric helical winding around column axis. Original Source
Figure 37. National Institute of Standards and Technology (NIST). Close-up view of perimeter column assembly demonstrating coaxial spandrel deformation with smooth continuous curvature. Original Source
Figure 38. National Institute of Standards and Technology (NIST). Heavy I-beams bent into smooth semicircles around their vertical strong axis, demonstrating orthogonal-axis deformation inconsistent with gravitational overload. Original Source
Figure 39. National Institute of Standards and Technology (NIST). WTC I-Beams Bent around the wrong axis. Monolithic steel column exhibiting smooth upward curl along its length, similar to bimetallic strip, demonstrating differential strain. Original Source, Figure 4-3, p. 203 (pdf 253 of 336)
Figure 40. National Institute of Standards and Technology (NIST). (2001, September 5). WTC Perimeter column panels with their spandrel belts folded about a vertical axis. Steel column showing tight uniform curl with differential strain through thickness, inconsistent with thermal warping. Original Source
Figure 41. Federal Emergency Management Agency (FEMA). (2001, September 11). WTC Perimeter column panels stabbed into West Street, viewed from the North from the south. Perimeter wall section found stabbed vertically into street, remaining perfectly straight and unbuckled despite immense impact force required for penetration. Original Source
Figure 42. Unknown Photographer. (2001, September 13). Perimeter wall section penetrating concrete and asphalt, showing projectile remained straight while target catastrophically failed. Original Source
Figure 43. Unknown Photographer. WTC Perimeter beams stabbed into Church Street, 400 feet away from WTC2. Window panel from 77th floor of south tower showing survival of projectile with minimal deformation, demonstrating impedance matching. Original Source
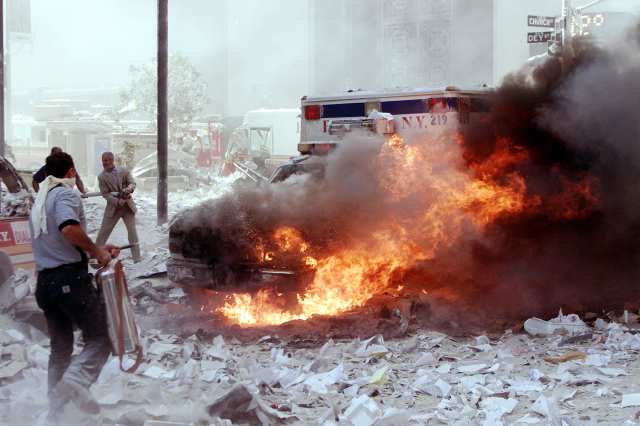
Report 6. Selective Impedance Heating and Node/Anti-Node Coupling in Vehicles (Conductor Regime)
Figure 44. Unknown Photographer. (2001, September 13). NYPD Car 2723 showing abrupt boundary between damaged front section with oxidized steel and pristine rear door, demonstrating selective impedance heating with sharp thermal boundary anomaly. Original Source
Figure 45. Unknown Photographer. (2001, September 11). Police car on West Broadway showing selective oxidation of conductive components while adjacent dielectrics remain intact, consistent with conductor-selective heating signatures in the West Broadway cluster. Original Source
Figure 46. Unknown Photographer. (2001, September 13). Interior of NYPD Car 2723 showing steel transmission hump perforated with small holes, confirming internal resistive heating from conductive-loop coupling. Original Source
Figure 47. Unknown Photographer. (2001, September 13). NYPD Car 2723 showing missing driver door handle and unusual unburned circular area on left rear door, demonstrating an interferometric node/anti-node pattern. Original Source
Figure 48. Unknown Photographer. (2001, September 11). NYPD vehicle indicating selective heating of conductive materials. Original Source
Figure 49. Unknown Photographer. (2001, September 11). Vehicle at street level showing fire damage despite being 1000+ feet below the event origin, consistent with interferometric node coupling (side-lobe analogue). Unburnt paper adjacent to the vehicle. Original Source
Figure 50. Unknown Photographer. (2001, September 11, before 5pm). Bus on West Broadway exhibiting selective conductive alteration with selectively oxidized exterior, demonstrating selective impedance heating in large conductive structures. Original Source
Figure 51. Ornelas, Edward A. (Photographer). (2001, September 14). Bus on West Broadway showing persistent selective damage pattern three days post-event, demonstrating conductor-selective alteration. Express-News. Original Source
Figure 52. Unknown Photographer. (2001, September 13). Vehicle showing anomalous rapid oxidation of exterior while unburnt seatbelts, upholstery, and plastic molding remain intact, demonstrating dielectric survival versus conductive failure. Original Source
Figure 53. Agam, Ron (Photographer)/Getty. Overturned vehicle on its side amid debris and scattered papers, damaged World Market Tower and One World Financial Center in background. Original Source
Figure 54. Unknown Photographer. Flipped car outside One World Financial Center (1 WFC), underside not heavily scuffed, consistent with lift-dominant displacement. Original Source
Figure 55. Unknown Photographer. Overturned sedan on wreckage with Seagrave fire truck in background; vehicle displacement evidence. Original Source
Report 7. Thermodynamic Signatures and Inverse Thermal Reactions
Figure 56. Unknown Photographer. (2001, September 11). West Broadway: vehicles burning near trees with paper debris on ground remaining unburned; trees and paper intact while nearby vehicles show selective oxidation, demonstrating paper survival next to burning steel. Original Source
Figure 57. Unknown Photographer. (2001, September 11). Ground-level vehicle with nearby plastic waste bucket and Igloo cooler (dielectric survival adjacent to altered vehicle). Original Source
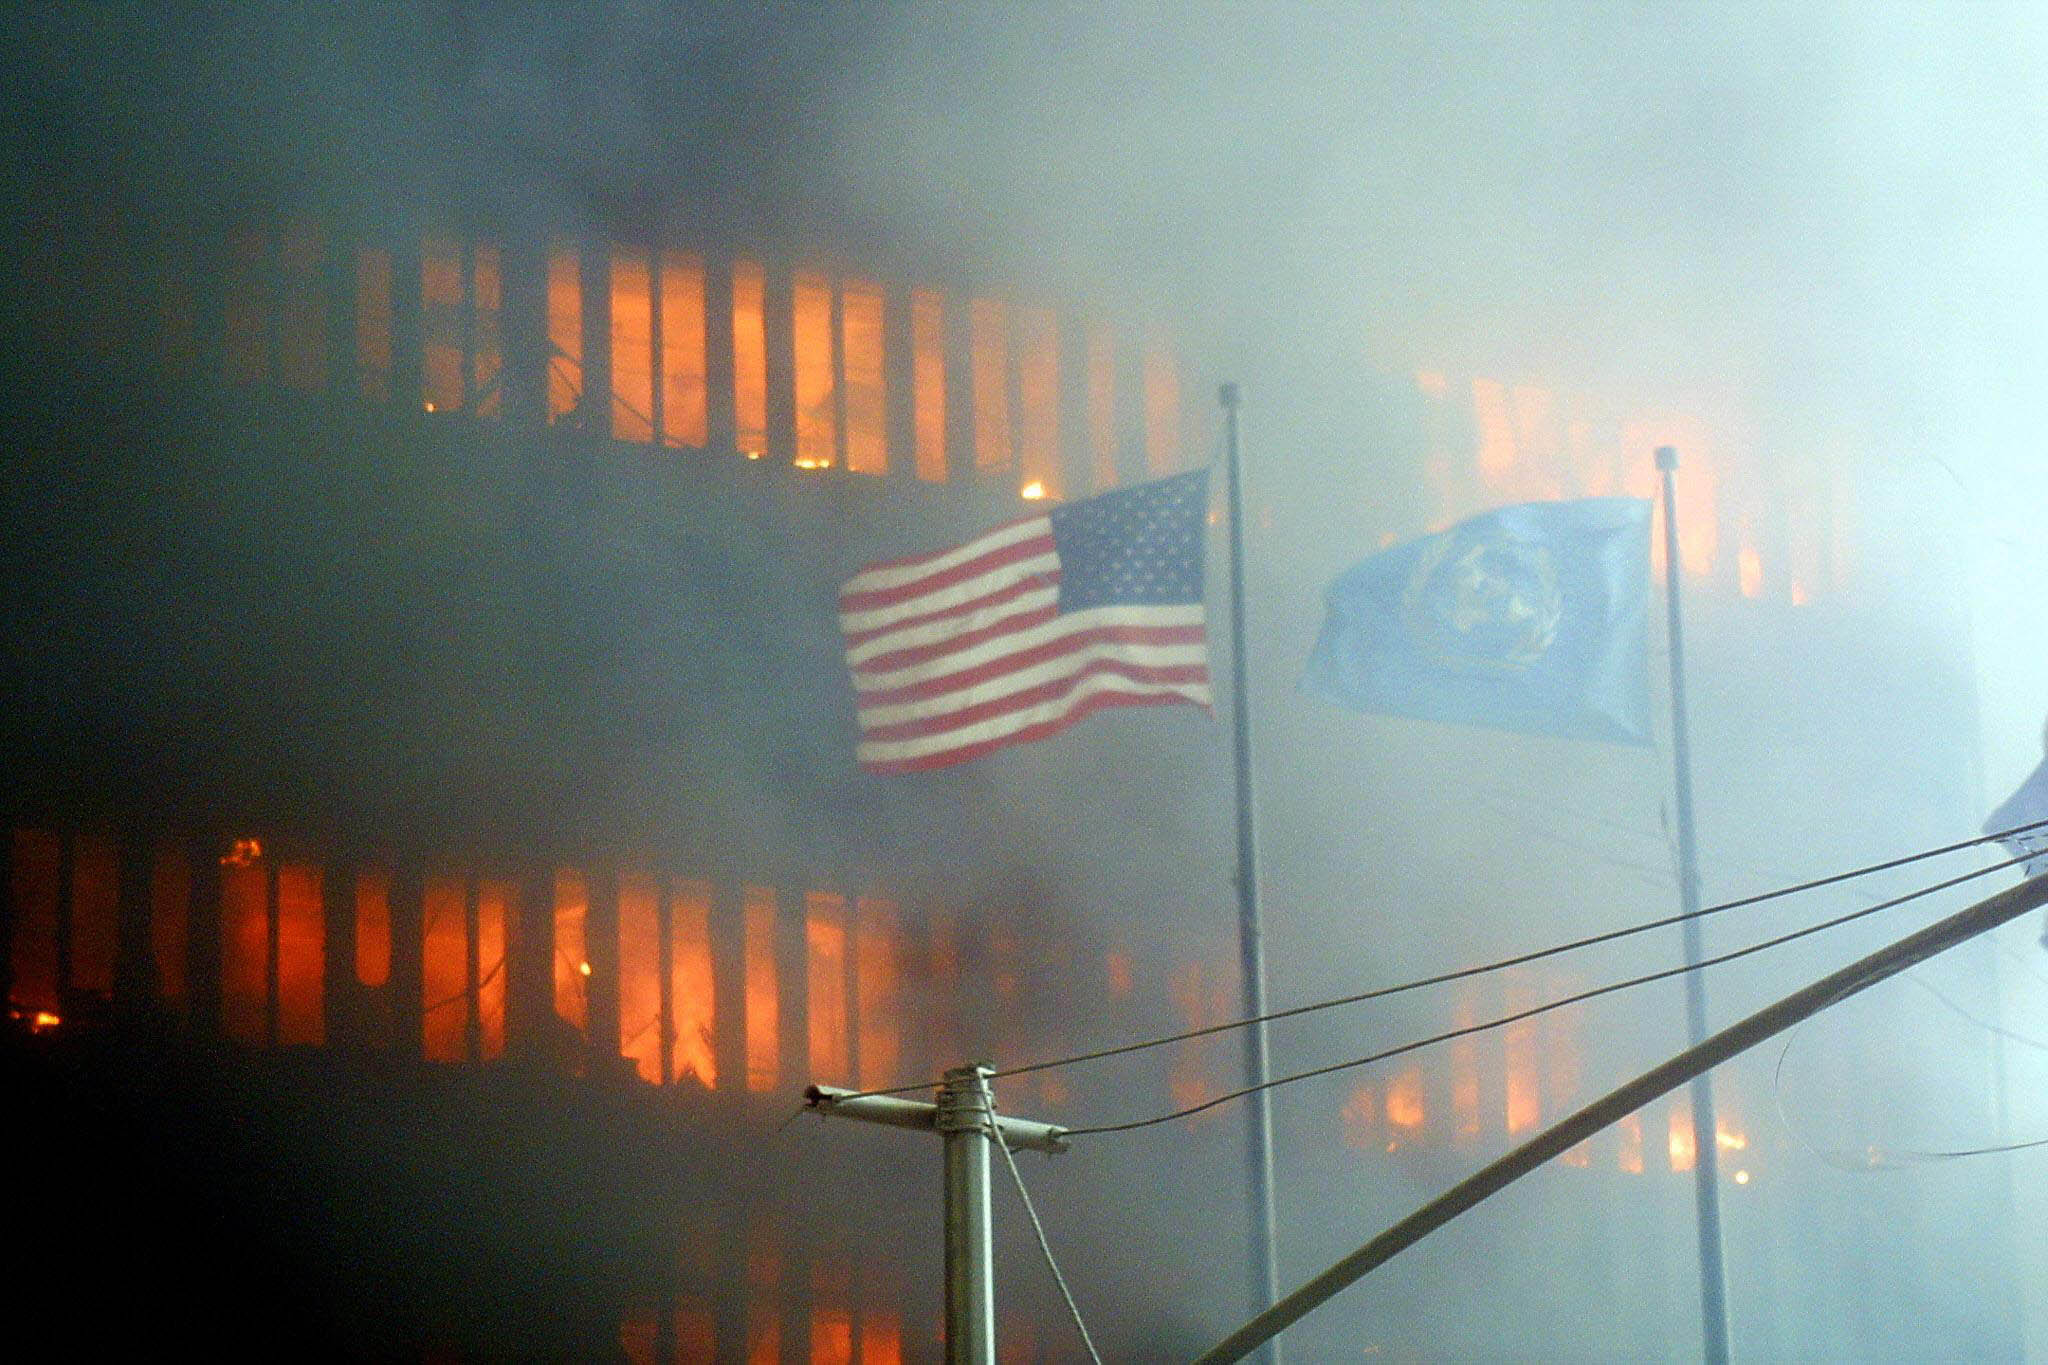
Figure 58. Kanter, Doug (Photographer). (2001, September 11). Flags outside WTC4 not burning, viewed from the east. American flag and UN flag flying in foreground remain unburned while WTC tower burns intensely in background, demonstrating inverse thermal reaction where dielectrics survive. Agence France-Presse (AFP). Original Source
Figure 59. Unknown Photographer. (2001, September 11). Minivan consumed by flames while paper-covered ground around it remains untouched, demonstrating selective impedance heating. Original Source
Figure 60. Federal Emergency Management Agency (FEMA). (2001, September 15 / September 20). Left: Dry weather, and the appearance of "steam". Rescue workers walking through debris pile exhibiting athermal aerosol emission, with water sprayed onto smoking zones failing to produce steam explosions. Right: Wet weather, and no steam. Oxy-fuel torch hoses draped across rubble without melting or exploding, demonstrating cool fire phenomenon and athermal aerosol emission. Original Source
Figure 61. Federal Emergency Management Agency (FEMA). (2001, September, date unknown). Workers at Ground Zero using Oxy fuel torch, the hose touching the rubble from pressurized tanks and not exploding from "high heat". Original Source
Figure 62. Silecchia, Frank (Photographer). (2001, September 21). The grappler (using hydraulics) is not seizing up or breaking. Heavy machinery digging into debris pile exhibiting athermal aerosol emission, with hydraulic cylinders and lines in direct contact, demonstrating low-temperature material state. Original Source
Figure 63. Silecchia, Frank (Photographer). (2001, September 21). Grappler machinery operating on debris pile with hydraulic systems intact, contradicting claims of molten steel at surface. Original Source
Figure 64. Chin, Alan (Photographer). (2001, September 11). Approximately 11 AM, Broadway and Liberty Street. Aluminum cladding and debris on ground exhibiting glow without burning adjacent materials, showing non-incandescent luminosity. Original Source
Figure 65. WABC-TV / National Institute of Standards and Technology (NIST). Material dripping from WTC2 glowing yellow-orange while adjacent materials do not burn, demonstrating anomalous luminosity. Image from NIST report that adjusted image color intensities. NISTNCSTAR1-5A, appendix C, Figure 9-77, page 382 (pdf page 86 of 268). Original Source (NIST acknowledges image color intensities adjusted)
Figure 66. Cazzaniga, Luigi (Photographer). (2001, September 11, 9:57:45 AM). Glowing material emerging from WTC2 maintaining color consistency during freefall, inconsistent with rapid cooling of molten metal, demonstrating electroluminescence. NISTNCSTAR1-5A, appendix C, Figure 9-77, page 384 (pdf page 88 of 268). Original Source (NIST acknowledges image color intensities adjusted)
Report 8. IMD/ECR Signatures and Oxidation Kinetics in Structural Steel
Figure 67. Federal Emergency Management Agency (FEMA). (2001-2002). Close-up of a highly-eroded wide-flange steel beam section with extreme erosion, flanges thinned to millimetric thickness exhibiting laminar exfoliation. Beam section "appeared to be from WTC7" (according to FEMA report [Ref: FEMA 403, Appendix C]). FEMA 403, Appendix C Figure C-2. Original Source
Figure 68. Unknown Photographer. (before September 21, 2001). Dissolving steel with recent and extensive rust. Steel beam showing severe localized section loss with curled flanges, demonstrating laminar thinning and anomalous porosity. Original Source
Figure 69. Unknown Photographer. (before September 21, 2001). Close-up view of dissolving steel with recent and extensive rust. Original Source (cropped)
Figure 70. Federal Emergency Management Agency (FEMA). (2001, September 16). Uniform rusted beams and pipes. Steel pipe or beam showing bright orange granular oxide with hyper-accelerated oxidation, demonstrating anomalous oxide propagation. (cropped from original, intensity adjusted). Original Source (cropped from original, intensity adjusted by Dr Judy Wood)
Figure 71. Dunlap, David W. (Photographer). (2001, January 7). Rusty beams from Bankers Trust building showing internal steel beams with heavy oxide growth, demonstrating latent catalytic mechanism and passivation failure. The New York Times. Original Source
Figure 72. Morris, D. / Astaneh-Asl, Abolhassan (Principal Investigator). (2001-2002, September). Steel beam showing extreme section loss with curled flanges and no visible slag pile, demonstrating dry erosion and field-mediated material removal. Steel from the site of Building 7. Figure 10. Original Source
Figure 73. Rodriguez, Bri (Photographer). (2001, September 27). Bankers Trust building showing large circular gash with prefabricated perimeter column assembly hanging suspended, demonstrating impedance mismatch. FEMA News. Original Source
Figure 74. Rieger, Michael (Photographer). (2001, September 20). Close-up view of Bankers Trust gash showing geometrically linear debris remaining unbent and pristine despite massive impact energy. Original Source
Figure 75. Unknown Photographer. Pepsi truck showing rust pattern resembling point-of-impact splash, with windshield glass gone but underlying paint discolored, demonstrating selective impedance heating. Original Source
Report 9. Athermal Particulate Suspension and IMD Ultrafine Fraction Analysis
Figure 76. Unknown Photographer. (2001, September 11). A block north from the WTC complex, looking west across the intersection of Murray & West Streets, course dust settles, while fine dust rises above the feet. Debris pile exhibiting continuous athermal aerosol emission with particulate wafting upward without wind or heat, demonstrating dielectrophoretic levitation. [http//memory.loc.gov/service/pnp/ppmsca/02100/02121/0076v.jpg]
Figure 77. Meadows, Tricia (Photographer). (2001, September 11). Fine and finer dust rises from the ground. Suspended particulate cloud or electro-static aggregates surrounding feet of pedestrians 15-20 minutes post-event, demonstrating athermal aerosol emission. Globe Photos. Original Source
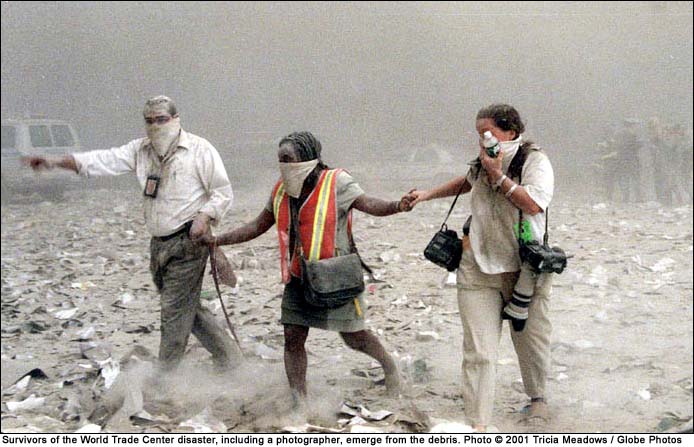
Figure 78. Federal Emergency Management Agency (FEMA). (2002, March 15). Debris truck with water sprayed onto it showing no steam production, confirming temperature below 100 degrees Celsius, while athermal aerosol emission continues. Original Source
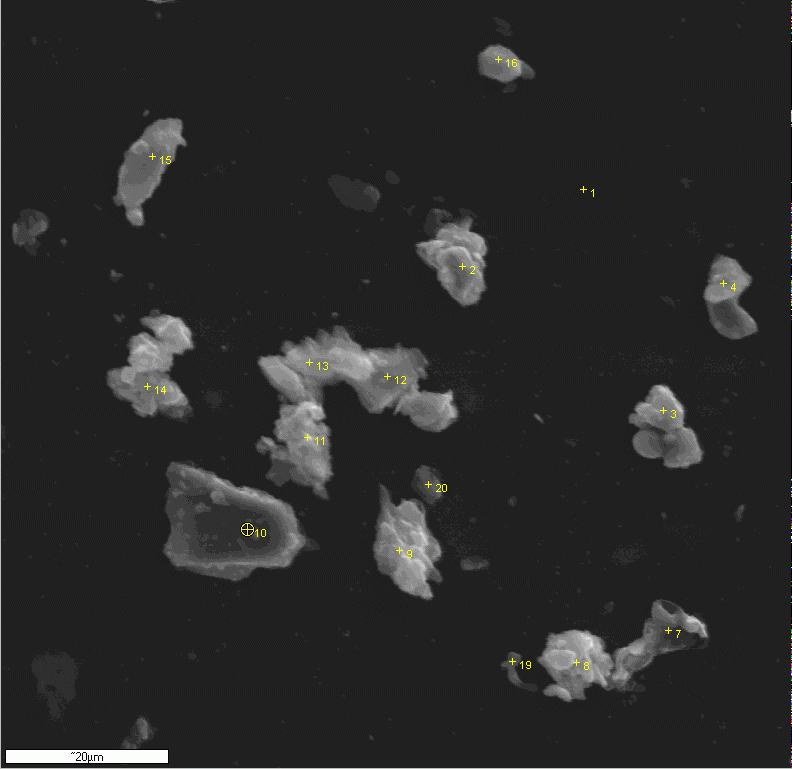
Figure 79. DELTA Group, University of California, Davis. A slide from the DELTA Group's fine dust samples. Scanning electron microscopy showing ultrafine particles in 90-260 nanometer range from a rooftop at 201 Varick Street, NYC on October 3, 2001 (1.8 km north-northeast of the WTC site), demonstrating nano-scale dissociation. Original Source
Figure 80. DELTA Group, University of California, Davis / Lawrence Berkeley Laboratory. Comparison Between WTC and Typical Aerosol Compositional Size Distribution from NYC at 201 Varick St., Oct 3, 2001 by Synchrotron X-Ray Fluorescence (XRF) at The Advanced Light Source. Particle size distribution chart shows elevated ultrafine counts in 0.09-0.26 micron range, 25-90 times smaller than red blood cells. Original Source
Figure 81. DELTA Group, University of California, Davis. DELTA Group particle-size distribution samples from (a) pulverisation, (b) molecular dissociation, (c) WTC samples. Analysis diagram comparing pulverization versus molecular dissociation in WTC samples, showing ultrafine particle composition with un-dissolvable glass and vanadium at nano-scale. Original Source
Figure 82. United States Geological Survey (USGS). (2005, April 28). (10μm - scale) Iron-rich sphere found in dust from the WTC. Using the scale on the image, the diameter of the iron-rich sphere is about 25μm. Microscopic analysis showing perfect iron-rich sphere approximately 25 micrometers, demonstrating localized transient softening and surface-tension spheroidization. Original Source
Figure 83. Broumas, Aaron (Photographer). (2001, October). WTC dust sample analysis showing iron-rich spheres with low carbon content, contradicting presence of massive hydrocarbon fires. Coarse Particles 5-12 um Aerodynamic Diameter Size Range from NYC at 201 Varick St. Early October, 2001 by Energy Dispersive Spectroscopy (slab in lower left is glass). Original Source
Figure 84. Uploaded by Teri L Conner. (2002, February 6). X-ray diffraction analysis of sieved WTC3 sample confirming relatively low levels of carbon, explicitly contradicting massive hydrocarbon fire hypothesis. Original Source
Report 10. Cloud Physics and Kinetic Rollout Violations
Figure 85. Sancetta, Amy (Photographer). (2001, September 11). WTC2 upper section beginning to tilt, showing initial angular momentum before spherical aerosolization. Associated Press (AP). NCSTAR1-6, page 183 (pdf p. 265) Original Source
Figure 86. Unknown Photographer. (2001, September 11). WTC2 tipping section dissolving into spherical snowball of expanding dust, demonstrating granular phase transition. Original Source
Figure 87. Spencer, Robert (Photographer). (2001, September 11). WTC2 upper section tilting and expanding outward into spherical aerosol configuration, showing rapid loss of structural cohesion. Associated Press (AP). NCSTAR1-6, page 183 (pdf p. 265) Original Source
Figure 88. Unknown Photographer. (2001, September 11). WTC2 mass expanding omni-directionally into particulate cloud, demonstrating coulomb explosion and rapid macroscopic aerosolization. Viewed from the south. Original Source
Figure 89. Price, Kelly (Photographer). (2001, September 11). A wall of dust moves down Broadway toward Pine Street from WTC2, at least ten stories high, maintaining height and verticality with uniform density from street level to top, demonstrating non-settling flow. Reuters. Original Source
Figure 90. Semendinger, Greg (Photographer). (2001, September 11). Arial view of the dust rolling out a particular distance then going up. Dust cloud rolling out horizontally and slowing to stop near Battery Park City, showing anomalous vertical volumetric expansion after forward momentum ceased. New York City Police Aviation Unit. Original Source
Figure 91. Semendinger, Greg (Photographer). (2001, September 11). Arial view from the northeast of the dust cloud showing secondary vertical rise after horizontal momentum ceased, demonstrating anomalous vertical volumetric expansion. New York City Police Aviation Unit. Original Source
Figure 92. Semendinger, Greg (Photographer). Aerial shot of the dust that rolled north, floating up, and blowing southward. The dust cloud rising vertically despite being cooler than ambient air, demonstrating athermal buoyancy and dielectrophoretic levitation. New York City Police Aviation Unit. Original Source
Figure 93. Semendinger, Greg (Photographer). (2001, September 11). Aerial view showing distinct coloration in clouds with dense dark fumes from WTC1 and lighter white dust from WTC2, demonstrating heterogeneous aerosol separation. New York City Police Aviation Unit. Original Source
Figure 94. Unknown Photographer. (2001, September 11). Distant view showing streams of dark fumes and white dust flowing adjacent without homogenizing, demonstrating immiscibility anomaly. Original Source
Figure 95. Unknown Photographer. (2001, September 11). Close-up view showing dense dark fumes blocking sunlight completely while lighter dust allows some light, demonstrating persistent separation. Original Source
Report 11. Volumetric Mass Deficit and Anomalous Vertical Boring Analysis
Figure 96. National Oceanic and Atmospheric Administration (NOAA). (2001, September 21). Close up of a NOAA aerial photograph showing WTC 6 with visible cylindrical vertical holes cutting through multiple floors. Cylindrical holes were seen in WTC5 and WTC6. Photo by NOAA's Cessna Citation Jet 3,300 feet above. Original Source
Figure 97. New York City Office of Emergency Management. (2001, September 15). Close-up view of cylindrical holes in WTC 5 and WTC 6 showing clean vertical boring through reinforced concrete floors. Original Source
Figure 98. Unknown Photographer. (2001, September 27). Two people viewing the interior of WTC 6, showing the massive vertical void extending through the 8-story building. Original Source
Figure 99. Federal Emergency Management Agency (FEMA). (2001, September 27). Interior view of WTC 6 showing the clean cylindrical hole extending vertically through the building with minimal debris accumulation. Original Source
Figure 100. Unknown Photographer. WTC4 showing main body completely missing with thin wing remaining standing, demonstrating clean vertical planar cut and field-boundary truncation. Original Source
Figure 101. National Oceanic and Atmospheric Administration (NOAA). (2001, September 23). Aerial shot by NOAA's Cessna Citation Jet 3,300 feet above WTC4 showing vertical planar cut separating missing main body from preserved wing section. Original Source
Figure 102. Unknown Photographer. WTC4 showing sliced boundary with vertical cut, demonstrating geometric precision inconsistent with debris impact. Original Source
Figure 103. Federal Emergency Management Agency (FEMA). (2001, September 21). Liberty Street Hole #1 adjacent to WTC2 and is through the sidewalk and pavement, revealing steel columns with sinusoidal deformation, showing wavy appearance as if unfolded. Original Source
Figure 104. Federal Emergency Management Agency (FEMA). (2001, September 21). Close-up view of Liberty Street showing shriveled beams and anomalous deformation patterns inconsistent with gravity-driven collapse. Original Source
Figure 105. Unknown Photographer. (2001, September 13). Steel beam showing missing lower portion while upper portion remains, contradicting top-down gravity damage pattern. Original Source
Figure 106. Unknown Photographer. (2001, September 13). Deep empty holes under Liberty Street. Additional view of anomalous beam deformation at Liberty Street showing athermal plasticity and field-mediated softening. Original Source
Report 12. Structural Integrity Analysis of the WTC Slurry Wall Enclosure
Figure 107. Unknown Photographer. View looking west from center of WTC 1 footprint showing the slurry wall bathtub with no significant structural damage despite two 110-story towers destruction. Original Source
Figure 108. Federal Emergency Management Agency (FEMA). (2002, March 15). Nearly cleaned-out bathtub showing big bathtub in foreground and shallow bathtub in background, with only superficial damage visible along eastern wall. Original Source
Figure 109. Unknown Photographer. (pre-September 11, 2001). PATH rail system station platform showing intact infrastructure directly within the foundation ring before 9/11. Original Source
Figure 110. Unknown Photographer. (shortly after September 11, 2001). Subterranean PATH tunnel showing intact rail infrastructure and tunnel arches directly beneath tower footprint. Original Source
Figure 111. Unknown Photographer. Dry PATH train tunnel. No significant structural damage in this PATH station platform with intact light fixtures and tunnel infrastructure showing minimal subgrade damage. Original Source
Figure 112. Port Authority Trans Hudson (PATH). (2002, February 22). Seven PATH Train cars which were parked in the PATH station under WTC were not crushed and were lifted from the bathtub. PATH cars 745 and 143 were carefully extracted from the sub-basements beneath the World Trade Center site. Original Source
Figure 113. Unknown Photographer. (before September 11, 2001). Warner Brothers Store in the WTC Mall on the concourse level (the first subbasement), viewed before 9/11. Original Source
Figure 114. Unknown Photographer. (after September 11, 2001). Store contents of the Warner Brothers Store in the WTC Mall, after 9/11. Looney Tunes ceramic figurines remaining upright and undamaged on store shelves in subgrade concourse. Original Source
Figure 115. Unknown Photographer. (after September 11, 2001). Subgrade mall concourse showing intact store fixtures and merchandise, demonstrating minimal ground-coupled disturbance. Original Source
Figure 116. Federal Emergency Management Agency (FEMA). (2001, October 10). Damage to slurry wall from earth-moving equipment along Liberty Street, demonstrating that cleanup operations caused more damage than the tower collapse event. FEMA Director tours with WTC worker. Original Source
Report 13. Comparative Seismic Telemetry and Kinetic Energy Transfer Analysis
Figure 117. Lamont-Doherty Earth Observatory / LCSN Station PAL. (2001, September 11, 17:20:33). Seismograms recordings of WTC7 on 9/11/01 at 17:20:33 by LCSN Station PAL (Palisades, NY) showing WTC 7 collapse registering only magnitude 0.6, virtually indistinguishable from urban noise floor. Original Source Data: Data: http://www.ldeo.columbia.edu/cgi-bin/LCSN/WebSeis/2001.pl orhttp://www.ldeo.columbia.edu/cgi-bin/LCSN/WebSeis/24hr_heli.pl?id=&jday=254&year=2001
Figure 118. Columbia University's seismographic recording station. Seismic signal from Columbia University's seismographic recording station of WTC2 destruction, showing an absence of Primary and Secondary body waves, dominated by short-period surface waves. Original Source
Figure 119. Columbia University's seismographic recording station. Seismic signal from Columbia University recording station showing 8-10 second duration (\(M_R\) = 2.3) matching free-fall timescale of WTC1 at 10:28:00 EDT with abrupt cutoff and no settling coda. Original Source
Report 14. Bio-Kinematic Anomalies and Dielectrophoretic Body-Force Analysis
Figure 120. Unknown Photographer. (2001, September 11). Falling approximately 20 feet horizontally outward from building face while passing the 45th floor, demonstrating hyper-kinetic launch trajectory. Original Source
Figure 121. Jimenez, Jose (Photographer). (2001, September 11). Energized flapping behavior of falling individual showing anomalous body movement consistent with field-induced repulsion. Primera Hora via Getty Images. Original Source
Figure 122. Christensen, Jeff (Photographer). (2001, September 11). Group of occupants hanging outside 105th floor windows of WTC1, showing disrobing behavior. Reuters. Original Source
Figure 123. Christensen, Jeff (Photographer). (2001, September 11). Close-up view showing occupants actively removing trousers while hanging by one hand or foot over 1000-foot drop, demonstrating dielectric heating response. Reuters. Original Source
Figure 124. Unknown Photographer. (2001, September 11). A falling body, establishing the reality of the falls and demonstrating the rain of people phenomenon. Original Source
Figure 125. Multiple Photographers. (2001, September 11). Montage of a large number of jumpers showing visual confirmation of high volume and frequency of falls, consistent with systemic environmental intolerance. Original Source
Figure 126. Jimenez, Jose (Photographer). (2001, September 11). Stream of fumes emerging from northwest corner of WTC 1 ejected in rigid horizontal vector away from building face, demonstrating dielectrophoretic plume forcing. Primera Hora. Original Source
Figure 127. Semendinger, Greg (Photographer). (2001, September 11). Contrast view showing fumes rising at standard 45 degree thermal angle versus anomalous horizontal ejection. New York City Police Aviation Unit. Original Source
Report 15. Synoptic Trap, Geomagnetic Synchronization, and Dielectric Lens Gating
Figure 128. National Aeronautics and Space Administration (NASA). (2001, September 11). Satellite view of Hurricane Erin showing Category 3 structure during anomalous near-stall period on September 11, 2001. Inset showing rising fumes from WTC site demonstrating atmospheric ionization and dielectric saturation effects. The dark fumes are moving west and dissipating, but the lighter fumes are heading due south. Original Source
Figure 129. National Oceanic and Atmospheric Administration (NOAA) Marine Prediction Center. (2001, September 1-17). Synoptic weather map tracking positions of Hurricane Erin at approximately 8 AM(EDT), [12 UTC] between September 1-17, 2001, showing Hurricane Erin's deceleration anomaly and near-stall plateau near NYC during WTC event window. Original Source Adapted by Dr Judy Wood from http://www.nhc.noaa.gov/prelims/2001erin1.gif
Figure 130. Wood, Judy (Researcher, using NOAA data). (2001, September 1-17). Wind speed, pressure, and relative location of Erin. Original Source (archival URL; may no longer be live)
Figure 131. National Geomagnetism Program, altered by Dr. Judy Wood. Magnetic declination map showing Hurricane Erin's path trending along isogonic geomagnetic contour geometry during synoptic trap. Original Source
Figure 132. Poleward expansion: geomagnetic H-component time series for 9/11/01 (6:00 AM–8:24 PM), with Kaktovik showing a pronounced negative bay dip during the afternoon window, consistent with latitude-dependent electrojet evolution.
Figure 133. Geophysical Institute, University of Alaska. (2001, September 11). Magnetometer chart showing geomagnetic anomalies and synchronization with WTC event timing demonstrating circuit gating mechanism. Original Source (archival URL; may no longer be live)
Figure 134. Unknown Photographer. (2001, September 11, 08:31-08:36 AM). A National Morning weather report map broadcast on 9/11/01 during 08:31-08:36 AM window. The weather was forecast to be 'As Nice as Can Be', but don't show Hurricane Erin. Original Source (broadcast capture curated by Wood) from https://11settembre-drjudywood.blogspot.com/2021/01/capitolo-20-la-correlazione-tesla.html
Figure 135. Wood, Judy (Researcher, using NASA/NOAA data). A superimposed image of Hurricane Erin on top of the news broadcast showing the approximate size and location of Category 3 hurricane Hurricane Erin at the time of the broadcast. Original satellite data, composite and annotation by Wood.
Dossier data curation — Judy Wood book
- Wood, J. (2010). Where Did the Towers Go? Evidence of Directed Free-Energy Technology on 9/11.
Used in this dossier primarily as a curated data compendium of photographs, image attributions, timelines, witness excerpts (FDNY/EMS/Port Authority / NYT 9/11 oral histories), and references to primary technical reports (FEMA 403, NIST NCSTAR series, LDEO/GIMA/NOAA, DELTA/UC Davis, etc.). The SCIE reports draw on this compilation to: - cross-check and normalize image provenance (photographers, agencies, dates, vantage points, original URLs);
- locate and group relevant witness accounts (e.g., selective-impedance vehicle damage (“toasted cars”), dust cloud rollout, bio‑kinematic telemetry, bathtub and WTC 4–6 anomalies); and
- surface pointers into primary-source archives (NYT oral histories, NOAA, FEMA, LDEO, GIMA, NHC, and others) for independent verification.
Interpretive conclusions in the SCIE dossier are developed within the dossier’s own audit framework; the book is cited here for its data curation role rather than as an authority on mechanism.
Chemical Analysis of World Trade Center Fine Particulate Matter
Several images in this dossier, particularly those in Report 9 (Athermal Particulate Suspension and IMD Ultrafine Fraction Analysis), reference scientific analysis of the fine particulate matter collected from the World Trade Center site. These analyses provide critical data on the particle size distribution, chemical composition, and material properties of the dust and aerosols generated during the event.
Chemical Analysis Study: The research paper "Chemical Analysis of World Trade Center Fine Particulate Matter for Use in Toxicologic Assessment" presents detailed analytical data on the composition and characteristics of WTC dust samples. This study includes X-ray diffraction analysis, particle size distribution measurements, and chemical composition data that are referenced in the dossier's analysis of the anomalous ultrafine particle fraction and low carbon content observations.
Reference:
- Chemical Analysis of World Trade Center Fine Particulate Matter for Use in Toxicologic Assessment: Original Source
Image use and copyright
The SCIE dossier incorporates images from multiple sources, including:
- U.S. government agencies (e.g., NOAA, NASA, FEMA, USGS, PATH / Port Authority), which are generally public-domain or broadly re-usable under agency terms when properly attributed.
- News and commercial photo agencies (e.g., Reuters, AP, Getty, newspapers, magazines) and private photographers / websites (e.g., hereisnewyork.org, bocadigital.smugmug.com, nyartlab.com).
- Researcher-curated composites and plots (e.g., imagery and graphics hosted at
doctorjudywood.com) based on underlying agency or instrument data.
Within this dossier, such images are used for the limited purposes of analysis, documentation, and critique—to illustrate specific forensic claims about geometry, mass balance, damage patterns, dust behavior, and related telemetry. Where images are not clearly in the public domain (for example, newswire photographs and privately hosted material), they should be understood as copyrighted works reproduced here under a research / commentary / fair‑use–style rationale, not as freely re-licensable assets.
Anyone reusing material from this dossier—especially outside a research/critique context or in a commercial publication—should:
- Prefer agency/government originals (NOAA, NASA, FEMA, etc.) where possible, following each agency’s usage policy.
- Treat newswire and privately sourced images as copyrighted, obtaining licenses or permissions as needed, or using only small, necessary, and well-attributed excerpts consistent with fair-use principles.
- Not assume that inclusion of an image here grants broader rights than those provided by the original source.
NIST Investigation
Several images referenced in this dossier originate from the National Institute of Standards and Technology (NIST) investigation into the World Trade Center collapses. NIST's investigation (2002-2008), led by Dr. Shyam Sunder, produced extensive documentation including structural analysis, material testing, and photographic evidence. NIST maintains a public repository of photographs, videos, and computer simulations from the investigation, which includes both NIST-generated materials and collected materials from media, public agencies, and individual photographers.
Many images, particularly those documenting steel beam sections with extreme erosion and laminar exfoliation, originate from FEMA 403, Appendix C, which contains detailed photographic documentation of steel specimens recovered from the World Trade Center site.
References:
- FEMA 403 Appendix C: Original Source
- FEMA Photo Library - World Trade Center: Original Source
- NIST NCSTAR 1: Final Report on the Collapses of the World Trade Center Towers: Original Source
- NIST NCSTAR 1-3: Mechanical and Metallurgical Analysis of Structural Steel: Original Source
- NIST NCSTAR 1-5: Reconstruction of the Fires in the World Trade Center Towers: Original Source
- NIST NCSTAR 1-5A: Visual Evidence, Damage Estimates, and Timeline Analysis: Original Source
- NIST World Trade Center Investigation Photos, Videos, and Simulations: Original Source
Note: Some images may have incomplete citation information. Where photographer names, dates, or source information are missing, they have been noted as such. If additional source information becomes available, this reference list will be updated accordingly.