Now Playing
Geometric Constraints & Spatial Periodicity
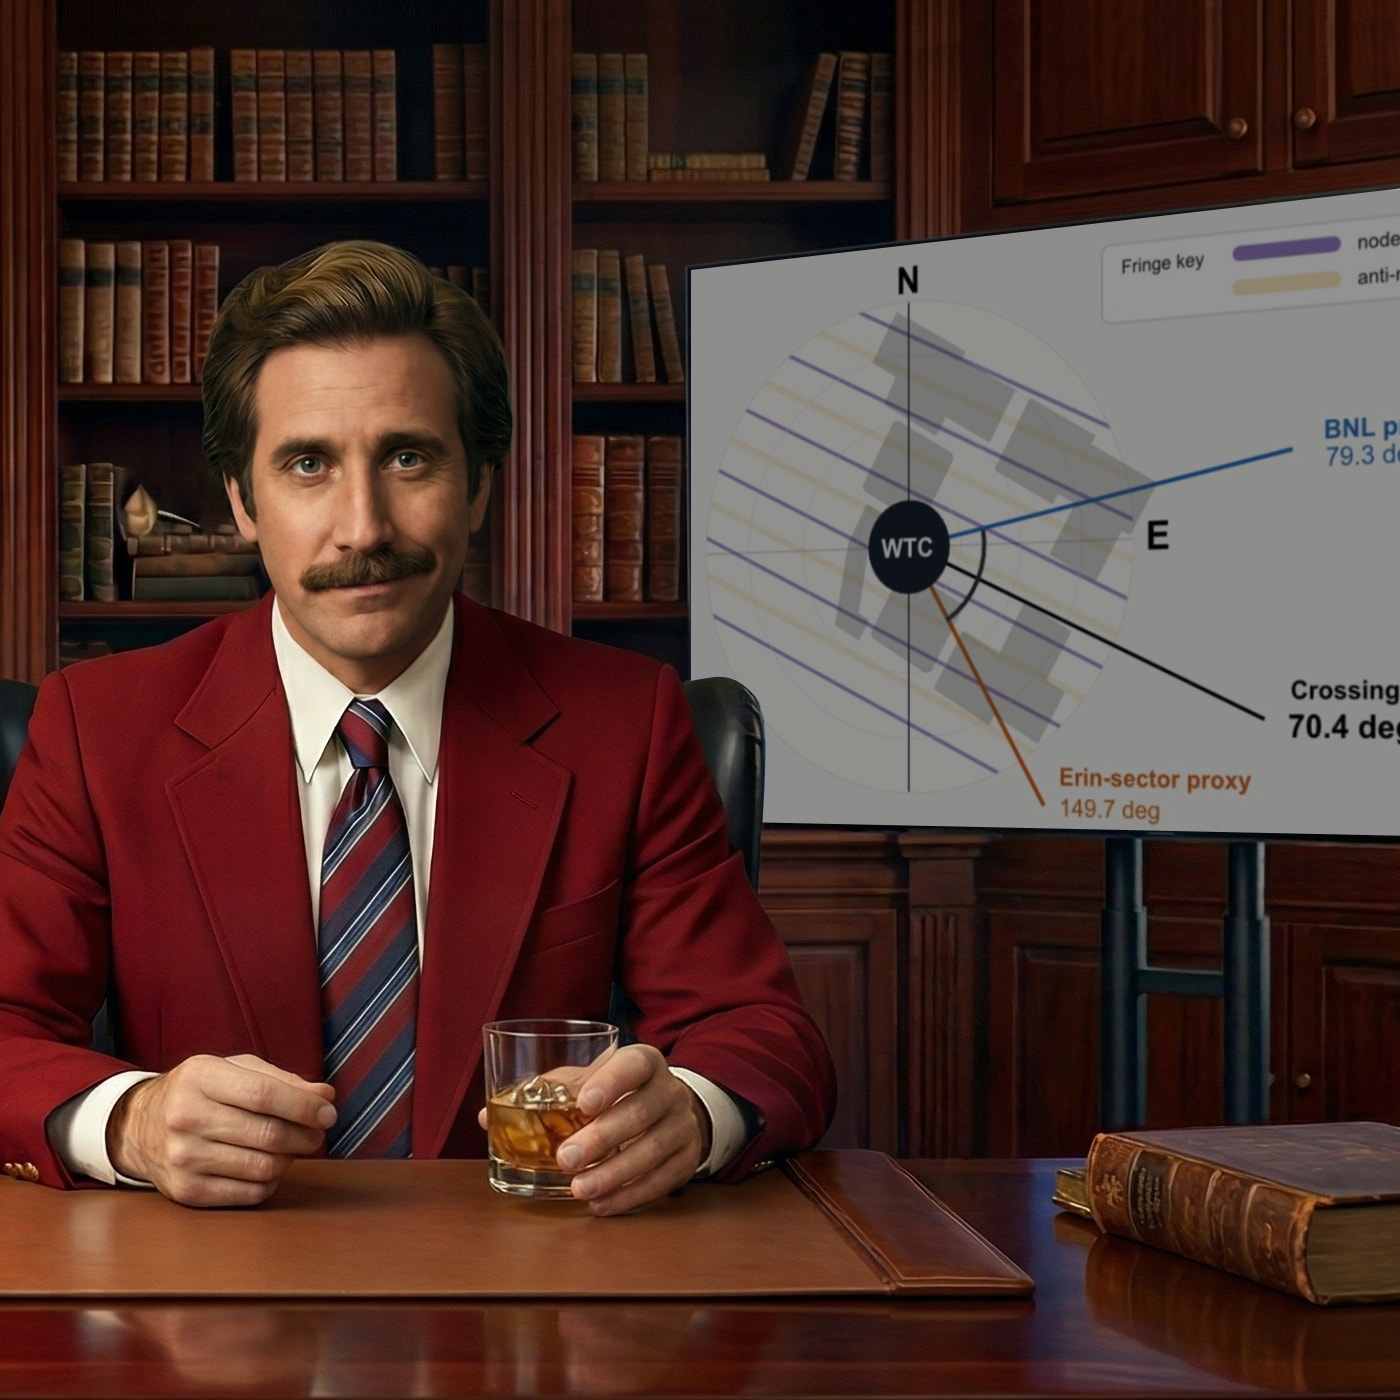
Two directions meet over Lower Manhattan at roughly 70.4 degrees: one from inland to the east-northeast, linked in the dossier to a regional high-frequency source, and one from the Atlantic side tied to where Hurricane Erin sat stalled off the coast. That crossing angle helps set how far apart the strongest zones of damage should fall on the ground, and when you work backwards from the size of major voids and cut boundaries at the site, the math points to a radio-frequency range of about 2.6 to 10 megahertz. When a massive building comes down, most people expect messy, uneven damage with the geometry of the destruction looking irregular. The pattern at the site is tighter and more structured than that.
Transcript
[00:00:00] **Wes:** Welcome to the episode on interferometric geometry and the spatial periodicity test.
[00:00:04] **Audrey:** We are the Armchair Physicists, dossier co-authors.
[00:00:08] **Wes:** And today we are walking you through the dossier's most quantitative testable geometry constraint. We are evaluating physical boundary constraints and spatial predictions to see what kind of energy delivery mechanisms they support, or conversely, what they actually burden.
[00:00:23] **Audrey:** That's it. And I think we need to set our guardrails right at the top here. We are staying strictly at the appendix level today.
[00:00:30] **Wes:** Yeah, that is super important.
[00:00:31] **Audrey:** So our focus is squarely on geometric constraints, spatial predictions, statistical tests, and our carry-forward judgments based entirely on the data. We are going to look closely at the fringe spacing geometry document and the spatial periodicity test document.
[00:00:46] **Wes:** We aren't jumping to conclusions here.
[00:00:48] **Audrey:** We are not jumping to final proofs, and we are emphatically not making definitive hardware attributions or naming a specific emitter source.
[00:00:55] **Wes:** Which is what everyone always wants us to do, but that is not the goal.
[00:00:58] **Audrey:** Our mandate is just to evaluate the physical boundaries of the data and establish the specific anomalies that the standard account, Model A, the standard kinetic collapse and fire model, actually has to explain.
[00:01:11] **Wes:** Right. Because before you can even begin to evaluate a hypothesis about what energy delivery mechanism was present, you have to meticulously define the physical reality on the ground.
[00:01:21] **Audrey:** Absolutely.
[00:01:21] **Wes:** And a massive part of that reality involves bounded geometries. So, let me start by setting up what we're actually testing against here. When we look at report 11 in the dossier and we talk about the standard model expectation, the natural intuition for you, the listener, is probably that a massive skyscraper collapsing naturally creates massive holes.
[00:01:41] **Audrey:** Right. That is what anyone would assume.
[00:01:43] **Wes:** Yeah. Deep cuts and unpredictable chaotic damage paths. If hundreds of thousands of tons of material are falling from the sky, why is this specific geometry we highlight in the dossier considered such a structural burden for ordinary gravity and kinetic impact?
[00:01:57] **Audrey:** Well, that is the fundamental threshold question we have to start with. To understand why the geometry constrains the model, we have to look really closely at what stochastic kinetic collapse actually predicts.
[00:02:09] **Wes:** Okay, lay that out for us.
[00:02:11] **Audrey:** Sure. When we use the term stochastic kinetic collapse, we are referring to the gravity-driven random falling debris acting under standard Newtonian physics.
[00:02:21] **Wes:** Basically just things falling down because they are heavy.
[00:02:23] **Audrey:** When hundreds of thousands of tons of steel and concrete fall, the physics of dynamic fracture and kinetic impact predict irregular, highly uneven crushing. If you evaluate the forces involved, you expect to see shattering, localized punch-outs and highly uneven damage gradients.
[00:02:41] **Wes:** A chaotic mix, basically.
[00:02:42] **Audrey:** Right. A chaotic mix of structural survival and total destruction. But most critically, you expect what we call local inventory and choke terms.
[00:02:50] **Wes:** Okay, let's break that down for the listener because that is a really important concept. When you say local inventory and choke terms, you're basically talking about a mass accounting problem.
[00:02:59] **Audrey:** That is a great way to put it.
[00:03:00] **Wes:** Because the rubble has to go somewhere. I mean, if you punch a hole through a ceiling, the drywall and the object that punched the hole don't just vanish into thin air, they land on the floor below.
[00:03:10] **Audrey:** Absolutely. It is an unavoidable consequence of conservation of mass and momentum.
[00:03:14] **Wes:** Right.
[00:03:15] **Audrey:** If a heavy mass of falling debris punches through a reinforced concrete floor, it takes the mass of that destroyed floor with it. As this growing mass hits the next floor down, it accumulates even more mass, spreading outward mechanically and slowing down due to the resistance of the structure.
[00:03:31] **Wes:** Which creates the choke point.
[00:03:32] **Audrey:** Yes, it inherently creates a choke point. You end up with a massive pile of comminuted or heavily fragmented debris piling up at the bottom of the punch-through pathway.
[00:03:42] **Wes:** So a gravity-driven collapse does not naturally create a clean empty tunnel.
[00:03:47] **Audrey:** No, it fundamentally cannot. But the empirical contradictions, specifically looking closely at World Trade Center 6, present a geometry that directly defies that choke term expectation.
[00:03:57] **Wes:** Okay, let's look at the specifics of World Trade Center 6, because this is where things get really weird. WTC 6 was the Customs House sitting right there in the complex. What exactly does the dossier carry regarding the damage to WTC 6 that burdens Model A?
[00:04:14] **Audrey:** Well, in WTC 6 we observe a scalloped cluster of bounded vertical voids.
[00:04:19] **Wes:** Like massive vertical tunnels.
[00:04:20] **Audrey:** Yes. When you look at the documentation, these are essentially aperture-like openings that cut vertically straight down through multiple reinforced concrete floors spanning all the way to the ground level.
[00:04:31] **Wes:** And how big are we talking here?
[00:04:32] **Audrey:** Within this larger void complex, there is a principal dark core or a sub-aperture with a lateral scale of roughly 25 to 30 meters. But the critical discriminator here is not just the hole itself, it is the inventory closure.
[00:04:46] **Wes:** The mass accounting problem again.
[00:04:48] **Audrey:** Yes. The interior of these deep scalloped voids was repeatedly described by responders on the ground as being largely empty, with limited visible terminus debris and no obvious pancaked floor stack at the base.
[00:05:00] **Wes:** Which is wild. Let's just have the listener think about what that actually means. If you are standing there looking at it, we have footprint stability. This repeating scalloped boundary that looks almost like a bite taken out of the building, and that is co-occurring with a massive missing mass problem. If a multi-ton section of the North Tower fell freely through the roof of WTC 6, we should absolutely see the pancaked crushed floors and the falling debris piled up in a massive mountain at the bottom of that specific hole.
[00:05:31] **Audrey:** You should. The physics demands it.
[00:05:33] **Wes:** Oh, for sure. So if the bottom of that void is largely empty, Model A is heavily burdened. It has to explain both how that clean vertically repeating scallop shape was cut without shattering the rest of the surrounding floor plate, and exactly where the local inventory, the concrete and steel from those missing floors, went at the exact time of imaging.
[00:05:53] **Audrey:** That is the crux of the bounded subtraction problem right there. A standard collapse-only account that loosely explains the existence of a hole, but leaves the missing terminus rubble as an open question, simply does not close the file.
[00:06:04] **Wes:** It's an incomplete accounting.
[00:06:06] **Audrey:** It is an incomplete accounting. And this bounded subtraction geometry is not an isolated anomaly confined just to WTC 6.
[00:06:14] **Wes:** Right. There is more.
[00:06:15] **Audrey:** Yeah. If we shift our focus to World Trade Center 4, we find a different yet equally constraining architectural anomaly: a large bounded planar truncation.
[00:06:27] **Wes:** Okay, that is a very technical term for a visually striking anomaly. Let's make sure that's perfectly clear for everyone listening. When we say planar truncation, instead of a chaotic irregular pile of rubble, imagine taking a giant, invisible, flat cutting board and slicing straight down through a building. The main body of the building is simply absent, while a thin wing remains standing upright.
[00:06:49] **Audrey:** Right. And again, we must measure this against the standard model expectation. Mechanical collapse and debris impact damage are inherently chaotic and irregular.
[00:06:58] **Wes:** They don't cut in straight lines.
[00:06:59] **Audrey:** No, they don't. Falling debris does not naturally predict a stable planar delineation between missing volume and preserved volume.
[00:07:06] **Wes:** Because it just smashes everything.
[00:07:08] **Audrey:** Achieving a knife-edge boundary from blunt impact requires a highly constrained impact geometry and a shielding history that must itself be strictly documented and proven by Model A. It is highly irregular.
[00:07:20] **Wes:** So we have these two massive architectural constraints. On one hand, random falling debris cannot neatly explain deep scalloped empty vertical voids in WTC 6. And on the other hand, it cannot naturally explain the clean vertical knife-edge amputations seen in WTC 4. If blunt kinetic impact struggles to explain this, we need a mechanism capable of producing bounded, precise zones of destruction right next to zones of total preservation.
[00:07:47] **Audrey:** The removed volume closes as a stable footprint problem rather than just generic irregular impact damage.
[00:07:53] **Wes:** And this observation leads us directly to the core analytical spine of today's episode—fringe spacing geometry, specifically wave interference mechanics.
[00:08:02] **Audrey:** Yes. If the geometry is tightly bounded, the analytical reconstruction must supply a mechanism for footprint control.
[00:08:09] **Wes:** Makes sense.
[00:08:10] **Audrey:** We require a physical framework that inherently creates sharp, predictable boundaries between areas of high intensity action and areas of low intensity preservation, and crossing wave fields provide exactly that geometric framework.
[00:08:24] **Wes:** Okay, let's transition into how crossing waves actually work, because this is where the physics gets incredibly fascinating.
[00:08:29] **Audrey:** It really does.
[00:08:30] **Wes:** If you drop two pebbles into a calm pond a few feet apart, the ripples spread out in circles, and eventually those two sets of ripples cross each other. Where the crest of one wave meets the crest of the other wave, the water gets pushed twice as high. Where a crest meets a trough, they cancel each other out and the water goes completely flat. We are looking at two crossing coherent waves doing something similar over the physical footprint of the World Trade Center complex, creating highly organized zones of intense energy and zones of relative calm.
[00:09:01] **Audrey:** I will validate the pebble analogy as a useful, accessible way to visualize the foundational concept of interference. It is a good starting point.
[00:09:09] **Wes:** But there is a caveat, I assume.
[00:09:10] **Audrey:** There is. However, I want to caution you, the listener, as we apply this to the dossier, do not equate this perfectly with a controlled, textbook double slit experiment in a vacuum.
[00:09:21] **Wes:** Because this is the real world.
[00:09:23] **Audrey:** Yes. We are dealing with intersecting plane waves in a highly complex, dense urban environment. But the mechanical principles you describe definitely hold true. When two coherent fields cross, their amplitudes add in phase.
[00:09:35] **Wes:** Okay, wait. Let's put a firm guardrail on the language right there, because accuracy is everything in this dossier. You said their amplitudes add in phase, they don't multiply.
[00:09:44] **Audrey:** That is a crucial distinction, and honestly a very common point of confusion. Constructive interference means the amplitudes physically add together algebraically.
[00:09:53] **Wes:** Understood.
[00:09:54] **Audrey:** We strictly avoid saying the peaks multiply because multiplication only applies when discussing the resulting intensity or nonlinear effects.
[00:10:01] **Wes:** Because intensity is proportional to the square of the amplitude.
[00:10:04] **Audrey:** That is exactly right. So when the physical amplitudes add in phase, you get distinct regions of significantly higher intensity and regions of destructive interference where they effectively cancel out.
[00:10:15] **Wes:** And this creates a very specific pattern across the physical space. It's basically like a massive invisible barcode laid over the city blocks.
[00:10:24] **Audrey:** Yes, that is a good way to visualize it.
[00:10:26] **Wes:** Which brings us to the dossier convention for how we actually name these zones. Well, let's state these definitions clearly once, so you can follow the geometry as we map it out.
[00:10:35] **Audrey:** Good idea. Under our dossier convention, we define fringe node lines as the intensity maxima. These are the high field regions where the amplitudes have added constructively. These are essentially the damage corridors.
[00:10:48] **Wes:** And the other areas?
[00:10:49] **Audrey:** Conversely, we define antinodes as the low field safe corridors where the fields have canceled.
[00:10:55] **Wes:** Got it.
[00:10:56] **Audrey:** I must note, though, that this specific terminology using node for the maximum intensity corridor is our project's internal convention to describe the geometric grid lines of spatial action. This sometimes differs from introductory physics textbooks, where a node might describe a point of zero amplitude.
[00:11:13] **Wes:** Right. We have to be careful with textbook definitions versus our operational definitions.
[00:11:17] **Audrey:** Sure. For the purposes of our reconstruction and the spatial periodicity test, fringe node lines are the stripes where the intense coupling and structural action occur.
[00:11:27] **Wes:** Got it. Node lines equal the high intensity damage corridors. Antinodes equal the low field safe corridors. So now that we have a mental model of how crossing waves inherently create these alternating parallel stripes of intensity and safety, the natural question becomes a geographic one.
[00:11:45] **Audrey:** Where are they?
[00:11:45] **Wes:** Right. How do we mathematically map this abstract physics concept onto the actual streets and buildings of the site? Where are these waves geometrically anchored? And how wide are these alternating stripes?
[00:11:58] **Audrey:** Well, to map this out spatially, the dossier establishes what we call geodetic proxy bearings.
[00:12:03] **Wes:** Proxy bearings?
[00:12:04] **Audrey:** Yes. These are directional anchors derived from the broader environmental and geographical context of the event, which is detailed further in the background documents.
[00:12:12] **Wes:** So what are the specific anchors?
[00:12:14] **Audrey:** The first anchor is the ENE, or East Northeast proxy bearing, which sits at roughly 79.3 degrees from True North.
[00:12:22] **Wes:** Okay, 79.3.
[00:12:23] **Audrey:** And the second anchor is the Erin sector proxy bearing coming from the southeast, which sits at roughly 149.7 degrees from True North.
[00:12:32] **Wes:** And we need to pause here, and add a vital caveat about what these bearings actually represent. The dossier is very specific that these are proxy bearings.
[00:12:41] **Audrey:** Emphatically, yes. These are bookkeeping geodetic proxy bearings for the incoming wave vectors. They represent geometric arrival sectors used to build the reconstruction's spatial grid. They are not definitive proof of a named specific hardware source, nor do they explicitly prove a specific emitter facility.
[00:13:01] **Wes:** We aren't pointing to a specific building on a map and saying the machine was right here.
[00:13:05] **Audrey:** Absolutely not. They are mathematical geometric anchors that allow us to test the spatial grid against the hardened damage coordinates.
[00:13:12] **Wes:** Okay, so we have two incoming wave directions—79.3 degrees and 149.7 degrees. If I am trying to build a geometry model, what is literally the very first thing I do with those two numbers?
[00:13:25] **Audrey:** You look at the geometric difference between them to find the crossing angle. The difference between 149.7 degrees and 79.3 degrees gives us an intersection or a crossing angle of roughly 70.4 degrees.
[00:13:40] **Wes:** 70.4 degrees.
[00:13:41] **Audrey:** This 70.4 degree angle is the exact angle at which these two hypothetical wave fronts intersect over the target region of the complex.
[00:13:50] **Wes:** And why is that specific 70.4 degree crossing angle so critical to the constraints we are evaluating? Why does that number actually unlock the spatial map?
[00:13:59] **Audrey:** Because in interferometry, at a fixed crossing angle, the physical spacing between the resulting fringe node lines depends entirely on the wavelength, or the frequency, of the intersecting waves.
[00:14:10] **Wes:** Okay, so the angle and the frequency lock in the spacing.
[00:14:13] **Audrey:** Yes. This mathematical relationship operates under the appendix's plane wave approximation and phase velocity mapping assumptions. The crossing angle acts basically as a geometric tuning knob for the grid. Once that angle is fixed at roughly 70.4 degrees, the geometry strictly fixes the ratio of the fringe spacing on the ground to the wavelength of the energy in the air.
[00:14:34] **Wes:** Got it. Okay, so the crossing angle determines how tightly packed the barcode stripes are based on the frequency of the wave. So what frequency band is the dossier actually looking at to see if this mathematical grid matches the physical damage anomalies we talked about earlier?
[00:14:51] **Audrey:** Well, the reconstruction carries a high frequency or HF band candidate.
[00:14:55] **Wes:** What's the range on that?
[00:14:56] **Audrey:** Specifically ranging from 2.6 to 10 MHz. If we assume a standard free space phase velocity for these waves, we can map those specific HF frequencies directly to physical fringe spacings on the ground at our fixed 70.4 degree crossing angle.
[00:15:15] **Wes:** And the math is highly specific here.
[00:15:17] **Audrey:** Very specific. At 2.6 MHz, the spacing between the constructive damaged node lines is roughly 100 meters. If we double the frequency to 5.2 megahertz, the spacing halves, bringing the distance between the node lines down to roughly 50 meters. And if we move to the upper end of the candidate band at 10 megahertz, the physical spacing tightens to roughly 26 meters.
[00:15:37] **Wes:** Okay, let's take those specific mathematical outputs, 100 meters, 50 meters, 26 meters, and apply those scales cautiously back to the physical site anomalies.
[00:15:47] **Audrey:** Yes, cautiously.
[00:15:49] **Wes:** Because that roughly 26-meter spacing at 10 MHz relates very closely to the WTC 6 principal dark core sub-aperture scale we discussed in report 11 — that roughly 25 to 30 meter bounded void. And the roughly 100 meter scale at 2.6 MHz relates directly to the WTC 4 boundary scale spacing, where we saw that massive planar truncation.
[00:16:12] **Audrey:** That alignment is correct. But we must rigorously use precise low-drama language here.
[00:16:17] **Wes:** Oh, for sure. No jumping to conclusions.
[00:16:19] **Audrey:** We are not declaring a slam dunk. This conditional geometry to band mapping supports and constrains the model.
[00:16:25] **Wes:** It doesn't prove it.
[00:16:26] **Audrey:** Right. It demonstrates mathematically that the physical scales of the architectural anomalies, the actual size of the voids and the cuts are consistent with the predictable fringe spacings produced by an HF band interference pattern crossing at that specific 70.4 degree angle.
[00:16:42] **Wes:** But it does not explicitly prove an emitter.
[00:16:45] **Audrey:** Correct. What it does is establish a highly specific quantitative parameter envelope that Model A's standard kinetic collapse theory cannot easily replicate or naturally explain.
[00:16:57] **Wes:** It sets the boundary conditions for what a viable theory must actually look like. So we've established that the spacing between the node lines matches the size of the damage features. But spacing is only half of the geometric puzzle, right?
[00:17:10] **Audrey:** Yeah, it is true.
[00:17:11] **Wes:** I mean a barcode can have the perfectly correct spacing between its lines, but if you tilt it sideways, it doesn't fit the package and the laser won't read it. We have to look at orientation. How do we test the actual direction that these node lines were running across the site?
[00:17:25] **Audrey:** That brings us to the second geometric derivation. Which is the bisector calculation.
[00:17:29] **Wes:** The bisector. Okay. How does that work?
[00:17:31] **Audrey:** In crossing wave geometry, the physical orientation of the resulting interference fringes across the ground is determined by the bisector of the two incoming wave vectors.
[00:17:40] **Wes:** So we just average them?
[00:17:42] **Audrey:** Yes. We take the arithmetic average of our two proxy bearings. So if you average 79.3 degrees and 149.7 degrees, the bisector is roughly 114.5 degrees from true north.
[00:17:56] **Wes:** Okay, so if I am looking at a map of lower Manhattan, that 114.5 degree angle predicts the actual physical orientation of the fringe node lines. The damaged corridor stripping across the entire site.
[00:18:10] **Audrey:** Yes. The geometry strictly dictates that the parallel node lines will run roughly east southeast to west northwest, extending infinitely exactly along that 114.5 degree bearing.
[00:18:21] **Wes:** And then we have to match that to the real world.
[00:18:23] **Audrey:** Right. Now, we must overlay and compare that mathematically predicted angle to the actual physical layout of the World Trade Center complex.
[00:18:32] **Wes:** And those buildings weren't aligned perfectly north-south?
[00:18:34] **Audrey:** No, they were not. The complex was rotated approximately 29 degrees east of True North. This means that the east-west structural faces of the actual buildings are oriented at roughly 119 degrees.
[00:18:46] **Wes:** Let me do that math out loud so we can see the constraint really forming here. The east-west faces of the actual building sit at roughly 119 degrees. And the physics of our crossing waves dictates that the interference node lines sit at roughly 114.5 degrees. So if I subtract one from the other, the variance between the predicted damage grid and the actual structural axis of the buildings is just 4.5 degrees.
[00:19:12] **Audrey:** The variance is under 5 degrees. This means the mathematically predicted fringe node lines are nearly perfectly parallel to the east-west architectural faces of the buildings.
[00:19:22] **Wes:** And this is where the geometric constraints move from just being interesting to deeply demanding on model A. Because those near-parallel node lines predict the specific orientation lock damage features documented in the reports.
[00:19:35] **Audrey:** Correct.
[00:19:36] **Wes:** We aren't just talking about generically sized holes anymore. We are looking at architectural amputations that follow a strict axis. For instance, this predicts the WTC 3 bisection strip. WTC 3 was the Marriott Hotel and it suffered a massive structural bisection that ran directly east-west right through the center of the structure.
[00:19:56] **Audrey:** Yes, it did.
[00:19:58] **Wes:** Furthermore, this nearly parallel orientation predicts the WTC 4 knife-edge survival boundary we discussed earlier, which sheared the building along that exact same east-west axis. The structural damage isn't just the right size to match the HF band spacing. It is strictly locked to the correct geometric orientation predicted by the bisector.
[00:20:18] **Audrey:** That is the crucial second constraint of the model right there. The band placement finding the spacing depends entirely on the crossing angle, which is the geometric difference between the bearings. The orientation finding depends entirely on the bisector, which is the sum, or the average, of the bearings. These are algebraically independent geometric constraints.
[00:20:37] **Wes:** You can't just fake both of them at the same time.
[00:20:39] **Audrey:** Having both match the physical anomaly simultaneously is significantly more restrictive and statistically burdened than either one alone. But as rigorous analysts, to move this from a visually compelling map overlay to a defensible scientific claim, we must apply a strict quantitative statistical test.
[00:20:58] **Wes:** We need real numbers.
[00:20:59] **Audrey:** Yes. We cannot rely on simply looking at maps, drawing lines and eyeballing alignments.
[00:21:04] **Wes:** Because visual overlays can easily succumb to human pattern matching and confirmation bias. If you look at enough chaotic data, your brain will absolutely draw a line through it.
[00:21:13] **Audrey:** That's human nature.
[00:21:14] **Wes:** Which brings us to the spatial periodicity test document. How do we rigorously test this predicted mathematical grid against the hardened actual real world damage coordinates?
[00:21:24] **Audrey:** We utilize a hardened coordinate data set. The spatial periodicity test relies on nine specific mathematically verifiable physical targets on the ground.
[00:21:32] **Wes:** Nine targets.
[00:21:33] **Audrey:** Right. To prevent the exact confirmation bias you mention, we strictly excluded any provenance-compromised non-primary examples. These nine spatial constraints feature sub-5-meter photogrammetric accuracy where used.
[00:21:48] **Wes:** Let's define that. What exactly do we mean by sub 5 meter photogrammetric accuracy? And what kind of specific anomalies are we actually including in this nine point data set?
[00:21:58] **Audrey:** Sure. Photogrammetric accuracy means we are deriving precise spatial coordinates from analysis of photographic evidence and mapping, anchoring the features to within 5 meters of their true real world position.
[00:22:09] **Wes:** So very tight tolerances.
[00:22:10] **Audrey:** Very tight, and the dataset itself includes a highly specific mix of vehicle anomalies and massive structural boundary constraints. For example, we have the NYPD car on Church Street, we have specific damaged vehicles located on West Broadway, and selectively flipped vehicles too.
[00:22:26] **Wes:** Okay, so we have the vehicles.
[00:22:28] **Audrey:** Yes. And we pair these smaller vehicle coordinates with the massive structural features we just discussed. The WTC 4 knife-edge boundary, the WTC 6 vertical void locus, the WTC 3 bisection strip and the WTC 5 southern partial collapse.
[00:22:47] **Wes:** Okay, so we have these nine rigorously defined accurate hardened coordinates mapped across the complex. We have our interferometric grid, our barcode with its spacing set by the HF band frequencies and its orientation fixed by the 114.5 degree bisector.
[00:23:03] **Audrey:** Yes.
[00:23:03] **Wes:** How do we mechanically test the grid against those nine points?
[00:23:07] **Audrey:** The test methodology is strictly defined. We fix the interferometric grid at the 114.5 degree bisector bearing. That angle does not change.
[00:23:15] **Wes:** The orientation is locked.
[00:23:16] **Audrey:** We then mathematically sweep the phase offset from 0 to 2 PI across our candidate frequencies.
[00:23:21] **Wes:** Let me translate "sweeping the phase" for the listener so we can visualize the actual test. Since we know the width of the stripes and we know the angle of stripes are tilted at, sweeping the phase is essentially sliding the entire barcode back and forth along that fixed angle.
[00:23:33] **Audrey:** Yes. Sliding it laterally.
[00:23:35] **Wes:** Right. We are moving the grid laterally to see if there's an optimal placement where the high intensity node lines simultaneously intersect the hardened anomaly coordinates.
[00:23:45] **Audrey:** That is a very accurate visualization of the spatial test. And the results of that phase sweep are what carry the true quantitative burden here.
[00:23:53] **Wes:** What were the results?
[00:23:54] **Audrey:** At both the 4.1 and 5.2 MHz frequencies within the HF band, finding an optimal phase alignment results in eight out of the nine hardened targets landing directly on or immediately adjacent to the constructive node lines.
[00:24:08] **Wes:** 8 out of 9?
[00:24:09] **Audrey:** Yes. 88% of the selected anomalies sit inside the narrow damage corridors.
[00:24:13] **Wes:** Wow.
[00:24:14] **Audrey:** Right. And if we assume a random scatter model under the stated null, meaning there's essentially a 50% coin flip for any given random point landing in a damaged node zone versus a safe antinode zone, the raw binomial P value for getting eight out of nine targets to hit the nodes is 0.0195.
[00:24:31] **Wes:** Wait, wait. I need to push back here on the statistics, because whenever I hear a P value that low, my radar goes up instantly.
[00:24:38] **Audrey:** As it should.
[00:24:39] **Wes:** Because if we are explicitly shifting the phase, sliding the grid back and forth to make the grid fit the points, and we are checking multiple different frequencies within the HF band to see which one works best, aren't we mathematically just hunting for a pattern until we find one?
[00:24:54] **Audrey:** It sounds like that, yes.
[00:24:55] **Wes:** How do we guard against circularity in that 0.0195 statistic?
[00:25:00] **Audrey:** That is the right analytical question to ask. And it directly addresses a statistical phenomenon known as the look elsewhere effect. I will explain that immediately.
[00:25:08] **Wes:** Please do.
[00:25:08] **Audrey:** Because we optimize the phase after the fact by sliding the grid to find the best fit, as you said. And because we mathematically test multiple structural scale frequencies across a candidate band, the raw statistical significance of 0.0195 is artificially inflated.
[00:25:24] **Wes:** So the number looks better than it actually is.
[00:25:26] **Audrey:** The dossier states explicitly that this raw P value is descriptive of the geometric fit. It is absolutely not a final proof of corrected statistical significance.
[00:25:35] **Wes:** So if we openly acknowledge the look elsewhere effect, and we admit the raw number is inflated by phase sweeping, what does the spatial periodicity test actually mean for our evaluation of the physical constraints? What does it carry forward?
[00:25:49] **Audrey:** Well, it means the aggregate fit across multiple frequency bands is what genuinely carries the quantitative burden against model A. While we optimize the phase, gravity driven falling kinetic debris does not naturally land in parallel repeating stripes spaced cleanly at 50 or 100 meter intervals, right?
[00:26:07] **Wes:** Falling rocks don't do that.
[00:26:08] **Audrey:** Even when allowing for the mathematical phase sweeping, finding a recurring mixed class alignment, hitting both selectively flipped street level cars and massive building shearing structural cuts simultaneously across a non-trivial bearing window demands locked rigorous follow up.
[00:26:24] **Wes:** So it's still a massive anomaly.
[00:26:25] **Audrey:** Yes. It creates a genuine testable quantitative burden for a simple random placement reading. It demonstrates mathematically that the spatial damage pattern on the ground is organized in a periodic way that model A struggles to naturally absorb or explain.
[00:26:41] **Wes:** Okay, I understand the burden, but to truly validate a pattern found by sweeping phases and testing multiple frequencies, basic scientific rigor says you need an independent data point.
[00:26:51] **Audrey:** Yes, you do.
[00:26:52] **Wes:** You need a coordinate that was not used to build, tune or optimize the original fit in any way. If the grid is real, it has to predict something outside its own training data. Which brings us to the inclusion of Building 7 in the spatial analysis.
[00:27:05] **Audrey:** World Trade Center 7 acts as the critical required holdout in this spatial analysis. It was explicitly excluded from the initial 9-point dataset, and it was entirely excluded from the subsequent phase optimization calculations.
[00:27:18] **Wes:** That's zero influence on the grid.
[00:27:19] **Audrey:** Zero. We built the spatial grid, optimized the phase solely for the primary targets, and then firmly locked the grid coordinates in place.
[00:27:28] **Wes:** And once that interferometric grid was mathematically locked and immovable, where did WTC 7 actually land in relation to the node lines?
[00:27:37] **Audrey:** Once scored entirely independently against the fixed locked grid, WTC 7 aligns on or near the constructive node lines across three of the four specific bands tested in the appendix: 2.6, 4.1 and 10 megahertz.
[00:27:52] **Wes:** Right.
[00:27:52] **Audrey:** The dossier frames this outcome as an exploratory holdout check .
[00:27:56] **Wes:** But again, with the standard caveats.
[00:27:58] **Audrey:** Always. But again, we must remain rigorously cautious with our terminology here. We state clearly that this is not proof beyond dispute of an emitter.
[00:28:07] **Wes:** So we have walked through the WTC 6 vertical voids, the WTC 4 planar amputations, the bearings, the fixed crossing angle, the frequency dependent spacing, the orientation locked bisector and the exploratory Building 7 holdout check.
[00:28:22] **Audrey:** That's the core geometry, yes.
[00:28:24] **Wes:** If we synthesize all this geometry, what does this spatially periodic orientation locked damage grid actually constrain? When we look at the carryforward judgments in the dossier, what theories are burdened by this math?
[00:28:37] **Audrey:** It heavily burdens the statistical likelihood of several standard explanations. Stochastic scatter, the standard model A account of randomly falling kinetic debris, does not structurally create 88% alignments on a strictly periodic phase locked mathematical grid.
[00:28:52] **Wes:** Right. Randomness isn't periodic.
[00:28:54] **Audrey:** Correct. Furthermore, ordinary contiguous diffuse fire spread does not respect rigidly parallel 50 meter spaced wave interference nodes.
[00:29:02] **Wes:** Fire doesn't care about invisible lines.
[00:29:04] **Audrey:** No. Fire moves where there is fuel and air. It does not burn in perfectly parallel stripes across multiple city blocks. And simple omnidirectional point blast explanation standard high explosives are heavily burdened because point blasts inherently push energy outward radially in a sphere.
[00:29:24] **Wes:** Yes. They go in all directions.
[00:29:25] **Audrey:** They do not naturally create infinite parallel repeating structures across a massive geographic footprint.
[00:29:32] **Wes:** And the dossier is careful to note that this geometry even qualifies highly specific alternative theories like shaped or directional explosive theories. Because even a highly engineered shaped charge is ultimately a localized singular event. It lacks the periodic repeating structural signature across the entire site that the HF band mapping explicitly predicts and mathematically matches.
[00:29:54] **Audrey:** That is strictly correct. Instead of a localized kinetic or explosive event, the physical geometry points to a crossing wave field mechanism class within the HF band mapping envelope.
[00:30:04] **Wes:** It points to the wave class?
[00:30:05] **Audrey:** Yes. The bounded precision of the damage, the strict selectivity of the anomaly targets and the multi band spatial alignment strongly support a wave node based mechanism where destructive physical intensity appears primarily in the specific geographic corridors where multiple coherent fields intersect constructively.
[00:30:24] **Wes:** Right. And while the delivery path constraints, things like required lower atmosphere localization, propagation shaping by the local atmospheric conditions, and how the electromagnetic energy actually structurally couples to the physical targets are detailed extensively in the Bridge Mechanism Appendix document.
[00:30:43] **Audrey:** Yes, that's in the Bridge appendix.
[00:30:44] **Wes:** Right. But the exact source attribution and the specific hardware emitter remain securely in the bounded background. We are mathematically defining the exact shape of the lock based on the geometry left behind on the ground. We are not prematurely naming the key.
[00:30:58] **Audrey:** I think that is a very responsible way to state it.
[00:31:02] **Wes:** Ultimately, Model A is heavily burdened with explaining this mathematically strict periodic geometry in addition to the massive local mass inventory and bounded subtraction problems we established at the very beginning of the evaluation.
[00:31:14] **Audrey:** To summarize our findings strictly at the appendix level, the testable spatially periodic damage grid is orientation locked by the calculated bisector and frequency constrained by the mathematical crossing angle. Model A must account for this strict non-random geometry alongside the local inventory and knife-edge boundary problems we have rigorously outlined.
[00:31:35] **Wes:** Thank you for joining us.